Proctor and Gamble 2011 Annual Report Download - page 44
Download and view the complete annual report
Please find page 44 of the 2011 Proctor and Gamble annual report below. You can navigate through the pages in the report by either clicking on the pages listed below, or by using the keyword search tool below to find specific information within the annual report.-
 1
1 -
2
-
3
-
4
-
5
-
6
-
7
-
8
-
9
-
10
-
11
-
12
-
13
-
14
-
15
-
16
-
17
-
18
-
19
-
20
-
21
-
22
-
23
-
24
-
25
-
26
-
27
-
28
-
29
-
30
-
31
-
32
-
33
-
 34
34 -
 35
35 -
 36
36 -
 37
37 -
 38
38 -
 39
39 -
 40
40 -
 41
41 -
 42
42 -
 43
43 -
 44
44 -
 45
45 -
 46
46 -
 47
47 -
 48
48 -
 49
49 -
 50
50 -
 51
51 -
 52
52 -
 53
53 -
 54
54 -
55
-
56
-
57
-
58
-
59
-
60
-
61
-
62
-
63
-
64
-
65
-
66
-
67
-
68
-
69
-
70
-
71
-
72
-
73
-
74
-
75
-
76
-
77
-
78
-
79
-
80
-
81
-
82
 |
 |

42 The Procter & Gamble CompanyManagement’s Discussion and Analysis
Grooming net sales increased % to $.billion on volume growth
of 3%. Organic sales were up 5%. Price increases, taken primarily
across blades and razors in Latin America and developed regions,
contributed 2% to net sales growth. Volume grew high single digits
in developing regions and decreased low single digits in developed
regions. Volume in Male Grooming was up low single digits due to
higher shipments of blades and razors, mainly in developing regions
driven by market growth, and deodorants in North America, partially
offset by reduced volume in blades and razors in the developed
regions. Gillette Fusion shipments increased double digits behind the
continued expansion and success of Fusion ProGlide; while Mach3
shipments increased low single digits due to growth in developing
regions, partially offset by decreases in developed markets. Global
market share of the blades and razors category was down about
halfa point. Volume in Appliances decreased low single digits due to
competitive activity and a shift from low-tier, high volume products
tohigher-tier product offerings. Global market share of the dry shave
category was down half a point.
Net earnings increased 10% to $1.6billion behind higher net sales and
a100-basis point increase in net earnings margin. Net earnings margin
increased due to gross margin expansion, a lower effective tax rate
and a decrease in SG&A as a percentage of net sales. Gross margin
increased due to price increases, the favorable impact of volume scale
leverage and manufacturing cost savings. The tax rate decrease was
due to a shift in the geographic mix of earnings to countries with
lower statutory tax rates. SG&A as a percentage of net sales was down
due to lower foreign currency exchange costs and lower overhead
spending as a percentage of net sales due to sales leverage, partially
offset by higher marketing spending.
Net sales increased 3% to $7.6billion in 2010 on a 1% increase in
unitvolume. Price increases, taken primarily in developing regions to
offset currency devaluations and across blades and razors, added 4%
to net sales. Product mix had a negative 2% impact on net sales due
mainly to disproportionate growth in developing regions and of
disposable razors, both of which have lower than segment average
selling prices. Organic sales grew 3%. Volume in developing regions
increased low single digits, while volume in developed regions was in
line with the prior year. Volume in Male Grooming was up low single
digits mainly due to growth of disposable razors in developing regions.
Mach3shipments declined high single digits, while Gillette Fusion
shipments increased double digits behind the launch of the new Fusion
ProGlide. Global market share of the blades and razors category was
down about half a point versus the prior year. Volume in Appliances
was down low single digits behind a mid-single-digit decline in
developing regions, due mostly to market contractions and volume
share losses in home and hair care appliances. Global value share of
the dry shaving market was up half a point.
Net earnings increased 9% to $1.5billion in 2010 behind sales growth
and net earnings margin expansion. Net earnings margin increased
100-basis points driven by gross margin expansion and a lower tax rate,
partially offset by higher SG&A as a percentage of net sales. Gross
margin increased mainly due to price increases and manufacturing
cost savings. The reduction in the tax rate was mainly due to a shift in
the geographic mix of earnings to developing regions which generally
have lower statutory tax rates. The increase in SG&A as a percentage
of net sales was driven by higher marketing spending and incremental
foreign currency exchange costs, partially offset by lower overhead
spending as a percentage of net sales.
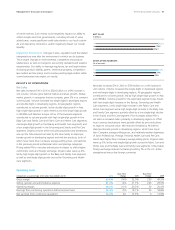
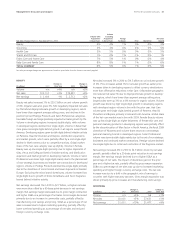
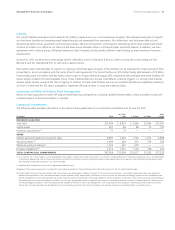
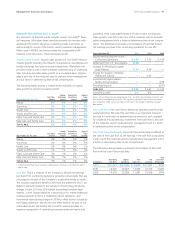
HEALTH CARE
($ millions) 2011
Changevs.
Prior Year 2010
Changevs.
Prior Year
Volume n/a +5% n/a +3%
Net sales $12,033 +5% $11,493 +2%
Net earnings $1,796 -3% $1,860 +1%
Health Care net sales increased 5% to $12.0billion on 5% growth in
unit volume. Organic sales were up 5%. Volume increased high single
digits in developing regions and low single digits in developed regions.
Volume in Oral Care grew mid-single digits behind initiative activity
and incremental merchandising support of Crest and Oral-B. Global
market share of the oral care category was up over half a point.
Volume in Personal Health Care grew low single digits behind higher
shipments of Vicks in North America and the developing regions,
partially offset by continuing decline of Prilosec OTC in North America
due to competitive activity. All-outlet value share of the U.S. personal
health care market increased about half a point. Volume in Feminine
Care was up mid-single digits mainly due to higher shipments of
Naturella, behind expansion into developing regions, and Always,
behind initiative activity in developing regions. Global market share of
the feminine care category was down less than half a point.
Net earnings decreased 3% to $1.8billion as higher net sales were
more than offset by a 130-basis point decrease in net earnings margin.
Net earnings margin decreased due to lower gross margin, higher
SG&A as a percentage of net sales and a higher effective tax rate.
Gross margin declined due to higher commodity costs and unfavorable
mix due to disproportionate growth in developing regions, partially
offset by manufacturing cost savings. SG&A as a percentage of net
sales increased behind higher marketing spending to support growth,
partially offset by lower foreign currency exchange costs. The tax
rateincrease was due to a shift in the geographic mix of earnings to
countries with higher statutory tax rates.
In July 2011, P&G and Teva Pharmaceutical Industries Ltd. reached a
definitive agreement to create a partnership in consumer health care
by bringing together both companies’ existing over-the-counter
medicine businesses and complementary capabilities. The partnership
is expected to have over $1.0billion in annual sales, only a portion of
which will be incremental to our Consolidated Financial Statements.
The Company expects the transaction to close by the end of the 2011
calendar year, pending necessary regulatory approvals.
Net sales increased 2% in 2010 to $11.5billion on unit volume growth
of 3%. Price increases, taken mainly in developing regions to offset
currency devaluations, added 1% to net sales. Unfavorable mix
reduced net sales by 2% mainly due to disproportionate growth in