Proctor and Gamble 2011 Annual Report Download - page 70
Download and view the complete annual report
Please find page 70 of the 2011 Proctor and Gamble annual report below. You can navigate through the pages in the report by either clicking on the pages listed below, or by using the keyword search tool below to find specific information within the annual report.-
 1
1 -
2
-
3
-
4
-
5
-
6
-
7
-
8
-
9
-
10
-
11
-
12
-
13
-
14
-
15
-
16
-
17
-
18
-
19
-
20
-
21
-
22
-
23
-
24
-
25
-
26
-
27
-
28
-
29
-
30
-
31
-
32
-
33
-
34
-
35
-
36
-
37
-
38
-
39
-
40
-
41
-
42
-
43
-
44
-
45
-
46
-
47
-
48
-
49
-
50
-
51
-
52
-
53
-
54
-
55
-
56
-
57
-
58
-
59
-
 60
60 -
 61
61 -
 62
62 -
 63
63 -
 64
64 -
 65
65 -
 66
66 -
 67
67 -
 68
68 -
 69
69 -
 70
70 -
 71
71 -
 72
72 -
 73
73 -
 74
74 -
 75
75 -
 76
76 -
 77
77 -
 78
78 -
 79
79 -
 80
80 -
81
-
82
 |
 |

68 The Procter & Gamble CompanyNotes to Consolidated Financial Statements
Amounts in millions of dollars except per share amounts or as otherwise specified.
Cash Flows. Management’s best estimate of cash requirements for
the defined benefit retirement plans and other retiree benefit plans
for the year ending June30,2012, is approximately $391 and $25,
respectively. For the defined benefit retirement plans, this is comprised
of $146 in expected benefit payments from the Company directly to
participants of unfunded plans and $245 of expected contributions
to funded plans. For other retiree benefit plans, this is comprised of
expected contributions that will be used directly for benefit payments.
Expected contributions are dependent on many variables, including
the variability of the market value of the plan assets as compared to
the benefit obligation and other market or regulatory conditions. In
addition, we take into consideration our business investment oppor-
tunities and resulting cash requirements. Accordingly, actual funding
may differ significantly from current estimates.
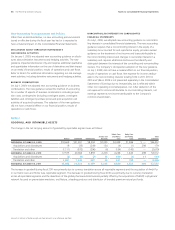
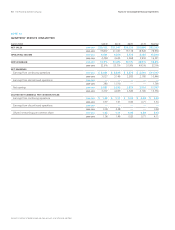
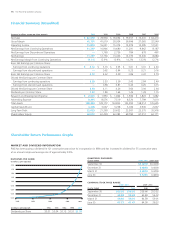
Total benefit payments expected to be paid to participants, which
include payments funded from the Company’s assets, as discussed
above, as well as payments from the plans, are as follows:
Years ending June30
Pension
Benefits
Other
Retiree
Benefits
EXPECTED BENEFIT PAYMENTS
2012 $534 $207
2013 535 225
2014 560 242
2015 573 259
2016 605 275
2017–2021 3,494 1,631
Employee Stock Ownership Plan
We maintain the ESOP to provide funding for certain employee benefits
discussed in the preceding paragraphs.
The ESOP borrowed $1.0billion in 1989 and the proceeds were used
to purchase Series A ESOP Convertible ClassA Preferred Stock to fund
a portion of the U.S. DC plan. Principal and interest requirements of
the borrowing were paid by the Trust from dividends on the preferred
shares and from advances provided by the Company. The original
borrowing of $1.0billion has been repaid in full, and advances from the
Company of $144 remain outstanding at June30,2011. Each share is
convertible at the option of the holder into one share of the Company’s
common stock. The dividend for the current year was equal to the
common stock dividend of $1.97 per share. The liquidation value is
$6.82 per share.
In 1991, the ESOP borrowed an additional $1.0billion. The proceeds
were used to purchase Series B ESOP Convertible ClassA Preferred Stock
to fund a portion of retiree health care benefits. These shares, net of
the ESOP’s debt, are considered plan assets of the other retiree benefits
plan discussed above. Debt service requirements are funded by pre-
ferred stock dividends, cash contributions and advances provided by
the Company, of which $405 is outstanding at June30,2011. Each
share is convertible at the option of the holder into one share of the
Company’s common stock. The dividend for the current year was equal
to the common stock dividend of $1.97 per share. The liquidation value
is $12.96 per share.
Our ESOP accounting practices are consistent with current ESOP
accounting guidance, including the permissible continuation of certain
provisions from prior accounting guidance. ESOP debt, which is
guaranteed by the Company, is recorded as debt (see Note 4) with
an offset to the reserve for ESOP debt retirement, which is presented
within shareholders’ equity. Advances to the ESOP by the Company
are recorded as an increase in the reserve for ESOP debt retirement.
Interest incurred on the ESOP debt is recorded as interest expense.
Dividends on all preferred shares, net of related tax benefits, are charged
to retained earnings.
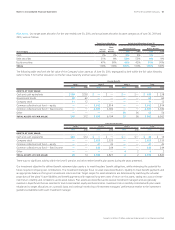
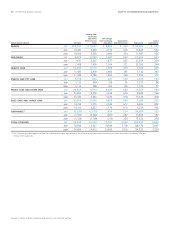
The series A and B preferred shares of the ESOP are allocated to
employees based on debt service requirements, net of advances made
by the Company to the Trust. The number of preferred shares out-
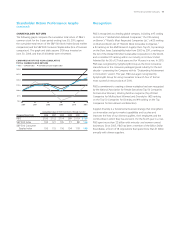
standing at June30 was as follows:
Shares in thousands 2010 2009
Allocated 52,281 54,542 56,818
Unallocated 13,006 14,762 16,651
TOTAL SERIES A 65,287 69,304 73,469
Allocated 20,759 20,752 20,991
Unallocated 40,090 41,347 42,522
TOTAL SERIES B 60,849 62,099 63,513
For purposes of calculating diluted net earnings per common share,
the preferred shares held by the ESOP are considered converted from
inception.
NOTE 9
INCOME TAXES
Income taxes are recognized for the amount of taxes payable for the
current year and for the impact of deferred tax assets and liabilities,
which represent future tax consequences of events that have been
recognized differently in the financial statements than for tax pur-
poses. Deferred tax assets and liabilities are established using the
enacted statutory tax rates and are adjusted for any changes in such
rates in the period of change.
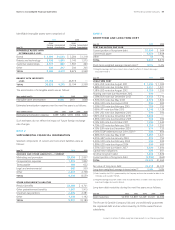
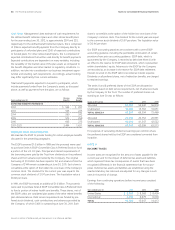
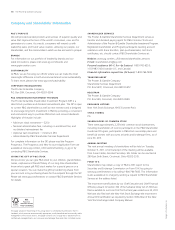
Earnings from continuing operations before income taxes consisted
of the following:
Years ended June 30 2010 2009
United States $8,983 $8,368 $8,409
International 6,206 6,679 6,004
TOTAL15,189 15,047 14,413