Proctor and Gamble 2011 Annual Report Download - page 61
Download and view the complete annual report
Please find page 61 of the 2011 Proctor and Gamble annual report below. You can navigate through the pages in the report by either clicking on the pages listed below, or by using the keyword search tool below to find specific information within the annual report.-
 1
1 -
2
-
3
-
4
-
5
-
6
-
7
-
8
-
9
-
10
-
11
-
12
-
13
-
14
-
15
-
16
-
17
-
18
-
19
-
20
-
21
-
22
-
23
-
24
-
25
-
26
-
27
-
28
-
29
-
30
-
31
-
32
-
33
-
34
-
35
-
36
-
37
-
38
-
39
-
40
-
41
-
42
-
43
-
44
-
45
-
46
-
47
-
48
-
49
-
50
-
 51
51 -
 52
52 -
 53
53 -
 54
54 -
 55
55 -
 56
56 -
 57
57 -
 58
58 -
 59
59 -
 60
60 -
 61
61 -
 62
62 -
 63
63 -
 64
64 -
 65
65 -
 66
66 -
 67
67 -
 68
68 -
 69
69 -
 70
70 -
 71
71 -
72
-
73
-
74
-
75
-
76
-
77
-
78
-
79
-
80
-
81
-
82
 |
 |

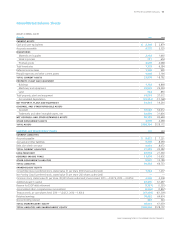
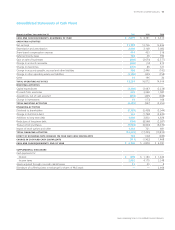
Notes to Consolidated Financial StatementsThe Procter & Gamble Company 59
Amounts in millions of dollars except per share amounts or as otherwise specified.
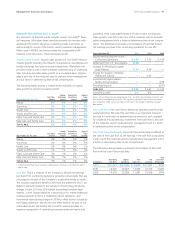
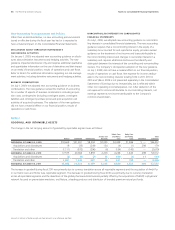
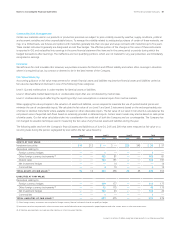
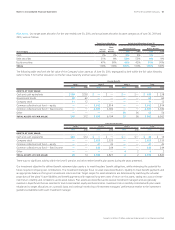
Identifiable intangible assets were comprised of:
2010
June30
Gross
Carrying
Amount
Accumulated
Amortization
Gross
Carrying
Amount
Accumulated
Amortization
INTANGIBLE ASSETS WITH
DETERMINABLE LIVES
Brands $3,392 $1,553 $3,284 $1,318
Patents and technology 3,195 1,840 3,140 1,575
Customer relationships 2,121 602 1,947 460
Other 335 217 304 205
TOTAL9,043 4,212 8,675 3,558
BRANDS WITH INDEFINITE
LIVES 27,789 — 26,519 —
TOTAL36,832 4,212 35,194 3,558
The amortization of intangible assets was as follows:
Years ended June30 2010 2009
Intangible asset amortization $546 $601 $648
Estimated amortization expenseover the next five years is as follows:
Years ended June 30 2012 2013 2014 2015 2016
Estimated amortization expense$499 $454 $393 $354 $324
Such estimates do not reflect the impact of future foreign exchange
rate changes.
NOTE 3
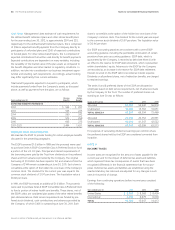
SUPPLEMENTAL FINANCIAL INFORMATION
Selected components of current and noncurrent liabilities were as
follows:
June30 2010
ACCRUED AND OTHER LIABILITIES — CURRENT
Marketing and promotion $3,058 $2,857
Compensation expenses 1,874 1,822
Taxes payable 786 622
Legal and environmental 885 500
Other 2,687 2,758
TOTAL9,290 8,559
OTHER NONCURRENT LIABILITIES
Pension benefits $4,388 $4,701
Other postretirement benefits 1,887 1,915
Uncertain tax positions 2,326 2,381
Other 1,356 1,192
TOTAL9,957 10,189
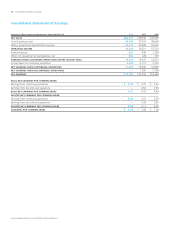
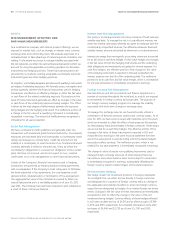
NOTE 4
SHORT-TERM AND LONG-TERM DEBT
June30 2010
DEBT DUE WITHIN ONE YEAR
Current portion of long-term debt $2,994 $564
Commercial paper 6,950 7,838
Other 37 70
TOTAL9,981 8,472
Short-term weighted average interest rates()0.9% 0.4%
(1) Weighted average short-term interest rates include the effects of interest rate swaps
discussed in Note 5.
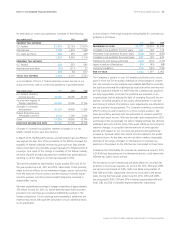
June30 2010
LONG-TERM DEBT
.35% USD note due August 2011 $1,000 $1,000
4.88% EUR note due October 2011 1,451 1,221
1.38% USD note due August 2012 1,250 1,250
Floating rate note due November 2012 500 —
3.38% EUR note due December2012 2,031 1,710
4.50% EUR note due May 2014 2,176 1,832
4.95% USD note due August 2014 900 900
3.50% USD note due February 2015 750 750
0.95% JPY note due May 2015 1,243 1,129
3.15% USD note due September 2015 500 500
1.80% USD note due November 2015 1,000 —
4.85% USD note due December 2015 700 700
5.13% EUR note due October 2017 1,596 1,344
4.70% USD note due February 2019 1,250 1,250
4.13% EUR note due December2020 871 733
9.36% ESOP debentures due 2011–2021(1)808 854
4.88% EUR note due May 2027 1,451 1,221
6.25% GBP note due January 2030 805 753
5.50% USD note due February 2034 500 500
5.80% USD note due August 2034 600 600
5.55% USD note due March 2037 1,400 1,400
Capital lease obligations 407 401
All other long-term debt 1,838 1,876
Current portion of long-term debt (2,994) (564)
TOTAL22,033 21,360
Fair value of long-term debt 23,418 23,072
Long-term weighted average interest rates(2)3.4% 3.6%
(1) Debt issued by the ESOP is guaranteed by the Company and must be recorded as debt of the
Company as discussed in Note 8.
(2) Weighted average long-term interest rates include the effects of interest rate swaps and net
investment hedges discussed in Note5.
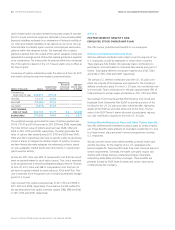
Long-term debt maturities during the next five years are as follows:
June30 2012 2013 2014 2015 2016
Debt maturities $2,994 $3,839 $2,229 $3,021 $2,300
The Procter& Gamble Company fully and unconditionally guarantees
the registered debt and securities issued by its 100% owned finance
subsidiaries.