Proctor and Gamble 2011 Annual Report Download - page 41
Download and view the complete annual report
Please find page 41 of the 2011 Proctor and Gamble annual report below. You can navigate through the pages in the report by either clicking on the pages listed below, or by using the keyword search tool below to find specific information within the annual report.-
 1
1 -
2
-
3
-
4
-
5
-
6
-
7
-
8
-
9
-
10
-
11
-
12
-
13
-
14
-
15
-
16
-
17
-
18
-
19
-
20
-
21
-
22
-
23
-
24
-
25
-
26
-
27
-
28
-
29
-
30
-
 31
31 -
 32
32 -
 33
33 -
 34
34 -
 35
35 -
 36
36 -
 37
37 -
 38
38 -
 39
39 -
 40
40 -
 41
41 -
 42
42 -
 43
43 -
 44
44 -
 45
45 -
 46
46 -
 47
47 -
 48
48 -
 49
49 -
 50
50 -
 51
51 -
52
-
53
-
54
-
55
-
56
-
57
-
58
-
59
-
60
-
61
-
62
-
63
-
64
-
65
-
66
-
67
-
68
-
69
-
70
-
71
-
72
-
73
-
74
-
75
-
76
-
77
-
78
-
79
-
80
-
81
-
82
 |
 |

Management’s Discussion and AnalysisThe Procter & Gamble Company 39
mainly due to divestiture gains in fiscal 2009, which included gains
on the sale of Thermacare, Noxzema, Infusium and other minor
brands, and incremental costs associated with exercising the call
option on an outstanding bond in 2010.
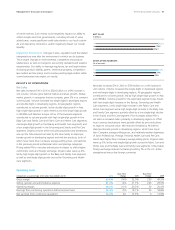
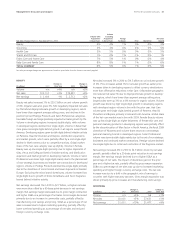
Income Taxes
The effective tax rate on continuing operations decreased 500 basis
points to 22.3%. This was primarily driven by net favorable discrete
adjustments (primarily driven by favorable audit and litigation settle-
ments for uncertain tax positions in multiple jurisdictions relating to
prior periods), which drove 410 basis points of the effective tax rate
difference. Net adjustments to tax balances for uncertain tax positions
in a number of jurisdictions resulted in a benefit of approximately
$535million in the current year, including a $252 million benefit from
the settlement of U.S. tax litigation primarily related to the valuation of
technology donations. In 2010, net discrete adjustments resulted in a
charge of $86 million, including a $152 million charge for legislation
which changed the taxation of certain future retiree prescription drug
subsidy payments in the United States. While there will likely be some
level of benefits from discrete adjustments on an ongoing basis, we
do not expect the magnitude of the adjustments experienced in fiscal
2011 to be sustainable. The current year tax rate also benefited from
the geographic mix of earnings, which drove a 50-basis point reduction
as an increased proportion of current year earnings were generated in
foreign markets with lower tax rates versus the U.S.
In 2010, the effective tax rate on continuing operations increased
140basis points to 27.3%. This was primarily due to a $152million
charge for legislation which changed the taxation of certain future
retiree prescription drug subsidy payments in the United States, the non-
deductibility of a $283million charge for competition law fines and a
lower level of net favorable adjustments to reserves for previously
existing uncertain tax positions and foreign tax credits, partially offset
by a more favorable geographic mix of earnings. During 2010, net
adjustments to prior-year reserves balances for uncertain tax positions
benefited the effective tax rate by 40 basis points versus a 130-basis
point benefit in 2009.
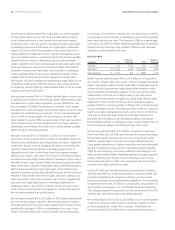
Net Earnings
Net earnings from continuing operations were $11.8billion in 2011,
an increase of 8% versus the prior year due mainly to net sales growth
and a lower effective tax rate, partially offset by operating margin
contraction. Operating margin decreased 110 basis points due to a
decrease in gross margin, partially offset by a decrease in SG&A
spending as a percentage of net sales. Gross margin declined behind
higher commodity costs, partially offset by manufacturing cost savings.
SG&A as a percentage of net sales declined due to reduced foreign
currency exchange costs and a reduction in overhead spending as a
percentage of net sales due to productivity improvements, partially
offset by increased marketing investments. Net earnings from continu-
ing operations were $10.9billion in 2010, an increase of 2% versus
the prior year due mainly to net sales growth and operating margin
expansion, partially offset by a higher effective tax rate. Operating
margin was up 30 basis points due to an increase in gross margin,
mostly offset by an increase in SG&A as a percentage of net sales.
Net earnings from discontinued operations decreased $1.8billion in
2011 mainly due to the impact of the gain on the divestiture of the
global pharmaceuticals business in the prior year. In 2010, net earnings
from discontinued operations, declined $1.0billion to $1.8billion due
to the loss of contribution from the pharmaceuticals business divested
in October 2009 and coffee business divested in November 2008
andlower gains on the sale of discontinued operations. The gains on
the sale of the global pharmaceuticals business in fiscal2010 were
$1.6billion versus a $2.0billion gain on the sale of the coffee business
in fiscal 2009.
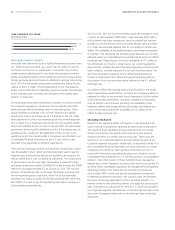
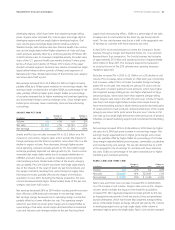
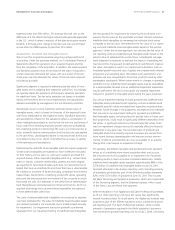
Diluted net earnings per share from continuing operations in 2011
increased 11% to $3.93 behind higher net earnings from continuing
operations and the reduction in shares outstanding. Diluted net
earnings per share from discontinued operations declined $0.58.
Diluted net earnings per share declined 4% to $3.93 driven by lower
net earnings from discontinued operations, partially offset by higher
net earnings from continuing operations and a reduction in weighted
average shares outstanding resulting from share repurchase activity.
The reduction in the number of shares outstanding was driven by
treasury share repurchases of $7.0billion, nearly all of which were
made under our publicly announced share repurchase program.
Diluted net earnings per share from continuing operations in 2010
increased 4% to $3.53 behind higher net earnings from continuing
operations and the reduction in shares outstanding. Diluted net
earnings per share from discontinued operations declined $0.29 to
$0.58. Diluted net earnings per share declined 4% to $4.11 driven
bylower net earnings from discontinued operations, partially offset
by higher net earnings from continuing operations and a reduction
inweighted average shares outstanding. The reduction in the number
of shares outstanding was driven by treasury share repurchases
of$6.0billion, nearly all of which were made under our publicly
announced share repurchase program.
$.26
$3.93
$4.11
11
09
10
DILUTED NET EARNINGS
(per common share)
Core EPS increased 8% to $3.95 in 2011. Core EPS represents diluted
net earnings per share from continuing operations excluding a current-
year benefit from the settlement of U.S. tax litigation primarily related
to the valuation of technology donations, charges in both 2011 and
2010 for competition law fines and charges in 2010 for legislation which
changed the taxation of certain future retiree prescription drug subsidy
payments in the United States. Core EPS grew 6% in 2010 to $3.67.