Proctor and Gamble 2011 Annual Report Download - page 78
Download and view the complete annual report
Please find page 78 of the 2011 Proctor and Gamble annual report below. You can navigate through the pages in the report by either clicking on the pages listed below, or by using the keyword search tool below to find specific information within the annual report.-
 1
1 -
2
-
3
-
4
-
5
-
6
-
7
-
8
-
9
-
10
-
11
-
12
-
13
-
14
-
15
-
16
-
17
-
18
-
19
-
20
-
21
-
22
-
23
-
24
-
25
-
26
-
27
-
28
-
29
-
30
-
31
-
32
-
33
-
34
-
35
-
36
-
37
-
38
-
39
-
40
-
41
-
42
-
43
-
44
-
45
-
46
-
47
-
48
-
49
-
50
-
51
-
52
-
53
-
54
-
55
-
56
-
57
-
58
-
59
-
60
-
61
-
62
-
63
-
64
-
65
-
66
-
67
-
 68
68 -
 69
69 -
 70
70 -
 71
71 -
 72
72 -
 73
73 -
 74
74 -
 75
75 -
 76
76 -
 77
77 -
 78
78 -
 79
79 -
 80
80 -
 81
81 -
 82
82
 |
 |
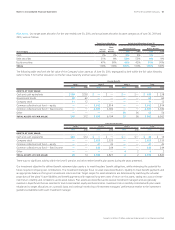
76 The Procter & Gamble Company
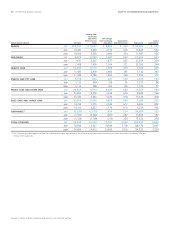
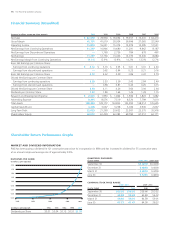
Amounts in millions, except per share amounts 2010 2009 2008 2007 2006
Net Sales $ 82,559 $78,938 $76,694$79,257 $72,441 $64,416
Gross Margin 41,791 41,019 38,004 39,996 37,065 32,549
Operating Income 15,818 16,021 15,374 15,979 14,485 12,551
Net Earnings from Continuing Operations 11,797 10,946 10,680 11,291 9,662 8,187
Net Earnings from Discontinued Operations —1,790 2,756 784 678 497
Net Earnings 11,797 12,736 13,436 12,075 10,340 8,684
Net Earnings Margin from Continuing Operations 14.3% 13.9% 13.9% 14.2% 13.3% 12.7%
Basic Net Earnings per Common Share:
Earnings from continuing operations $4.12 $ 3.70 $ 3.55$ 3.61 $ 3.01 $ 2.63
Earnings from discontinued operations —0.62 0.94 0.25 0.21 0.16
Basic Net Earnings per Common Share4.12 4.32 4.49 3.86 3.22 2.79
Diluted Net Earnings per Common Share:
Earnings from continuing operations 3.93 3.53 3.39 3.40 2.84 2.49
Earnings from discontinued operations —0.58 0.87 0.24 0.20 0.15
Diluted Net Earnings per Common Share 3.93 4.11 4.26 3.64 3.04 2.64
Dividends per Common Share1.97 1.80 1.64 1.45 1.28 1.15
Research and Development Expense $2,001 $1,950 $1,864$1,946 $1,823 $1,682
Advertising Expense 9,315 8,576 7,519 8,520 7,799 7,010
Total Assets 138,354 128,172 134,833 143,992 138,014 135,695
Capital Expenditures 3,306 3,067 3,238 3,046 2,945 2,667
Long-Term Debt 22,033 21,360 20,652 23,581 23,375 35,976
Shareholders’ Equity 68,001 61,439 63,382 69,784 67,012 63,171
Financial Summary(Unaudited)
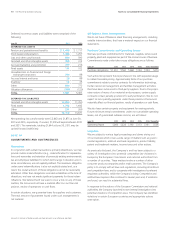
Shareholder Return Performance Graphs
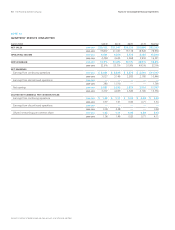
MARKET AND DIVIDEND INFORMATION
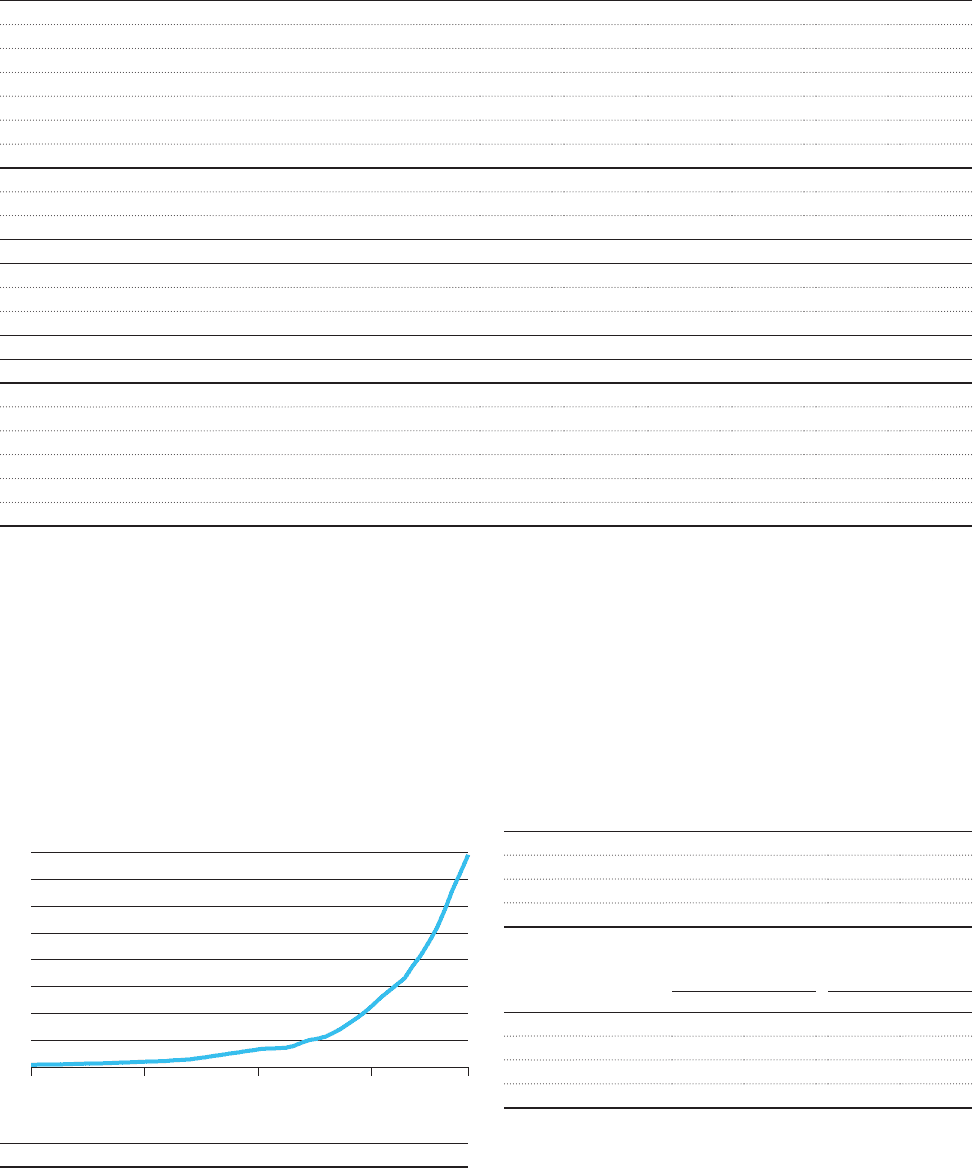
P&G has been paying a dividend for 121 consecutive years since its incorporation in 1890 and has increased its dividend for 55 consecutive years
at an annual compound average rate of approximately 9.5%.
COMMON STOCKPRICE RANGE
– 2009–2010
Quarter Ended High LowHigh Low
September 30 $63.36 $58.92 $58.66 $50.52
December 31 65.38 59.68 63.48 56.02
March 31 66.95 59.70 64.58 59.01
June 30 67.72 61.47 64.00 39.37
QUARTERLY DIVIDENDS
Quarter Ended – 2009–2010
September 30 $0.4818 $0.4400
December 31 0.4818 0.4400
March 31 0.4818 0.4400
June 30 0.5250 0.4818
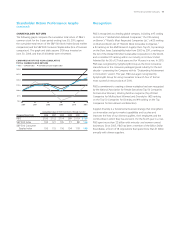
(in dollars; split-adjusted) 1956 1970 1984 1998
Dividends per Share$0.01 $0.04 $0.15 $0.51 $1.97
19841956 2011
19981970
0.25
0.00
1.75
1.25
1.00
0.75
0.50
2.00
1.50
DIVIDENDS PER SHARE
(in dollars; split-adjusted)