Proctor and Gamble 2011 Annual Report Download - page 76
Download and view the complete annual report
Please find page 76 of the 2011 Proctor and Gamble annual report below. You can navigate through the pages in the report by either clicking on the pages listed below, or by using the keyword search tool below to find specific information within the annual report.-
 1
1 -
2
-
3
-
4
-
5
-
6
-
7
-
8
-
9
-
10
-
11
-
12
-
13
-
14
-
15
-
16
-
17
-
18
-
19
-
20
-
21
-
22
-
23
-
24
-
25
-
26
-
27
-
28
-
29
-
30
-
31
-
32
-
33
-
34
-
35
-
36
-
37
-
38
-
39
-
40
-
41
-
42
-
43
-
44
-
45
-
46
-
47
-
48
-
49
-
50
-
51
-
52
-
53
-
54
-
55
-
56
-
57
-
58
-
59
-
60
-
61
-
62
-
63
-
64
-
65
-
 66
66 -
 67
67 -
 68
68 -
 69
69 -
 70
70 -
 71
71 -
 72
72 -
 73
73 -
 74
74 -
 75
75 -
 76
76 -
 77
77 -
 78
78 -
 79
79 -
 80
80 -
 81
81 -
 82
82
 |
 |

74 The Procter & Gamble CompanyNotes to Consolidated Financial Statements
Amounts in millions of dollars except per share amounts or as otherwise specified.
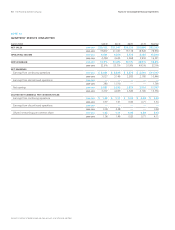
NOTE 13
QUARTERLY RESULTS (UNAUDITED)
Quarters Ended Sept 0 Dec 31 Mar 31 Jun 30 TotalYear
NET SALES – $20,122 $21,347 $20,230 $20,860 $82,559
2009–2010 19,807 21,027 19,178 18,926 78,938
OPERATING INCOME – 4,501 4,260 3,772 3,285 15,818
2009–2010 4,448 4,655 3,968 2,950 16,021
GROSS MARGIN – 51.9% 51.8% 50.5% 48.3% 50.6%
2009–2010 52.6% 53.7% 51.9% 49.5% 52.0%
NET EARNINGS:
Earnings from continuing operations – $3,081 $3,333 $2,873 $ 2,510 $11,797
2009–2010 3,027 3,149 2,585 2,185 10,946
Earnings from discontinued operations – —————
2009–2010 280 1,510 — — 1,790
Net earnings – 3,081 3,333 2,873 2,510 11,797
2009–2010 3,307 4,659 2,585 2,185 12,736
DILUTED NET EARNINGS PER COMMON SHARE:
Earnings from continuing operations – $1.02 $1.11 $0.96 $ 0.84 $3.93
2009–2010 0.97 1.01 0.83 0.71 3.53
Earnings from discontinued operations – —————
2009–2010 0.09 0.48 — — 0.58
Diluted net earnings per common share – 1.02 1.11 0.96 0.84 3.93
2009–2010 1.06 1.49 0.83 0.71 4.11