Proctor and Gamble 2011 Annual Report Download - page 68
Download and view the complete annual report
Please find page 68 of the 2011 Proctor and Gamble annual report below. You can navigate through the pages in the report by either clicking on the pages listed below, or by using the keyword search tool below to find specific information within the annual report.-
 1
1 -
2
-
3
-
4
-
5
-
6
-
7
-
8
-
9
-
10
-
11
-
12
-
13
-
14
-
15
-
16
-
17
-
18
-
19
-
20
-
21
-
22
-
23
-
24
-
25
-
26
-
27
-
28
-
29
-
30
-
31
-
32
-
33
-
34
-
35
-
36
-
37
-
38
-
39
-
40
-
41
-
42
-
43
-
44
-
45
-
46
-
47
-
48
-
49
-
50
-
51
-
52
-
53
-
54
-
55
-
56
-
57
-
 58
58 -
 59
59 -
 60
60 -
 61
61 -
 62
62 -
 63
63 -
 64
64 -
 65
65 -
 66
66 -
 67
67 -
 68
68 -
 69
69 -
 70
70 -
 71
71 -
 72
72 -
 73
73 -
 74
74 -
 75
75 -
 76
76 -
 77
77 -
 78
78 -
79
-
80
-
81
-
82
 |
 |

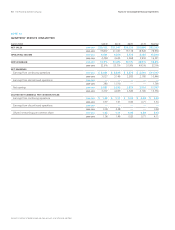
66 The Procter & Gamble CompanyNotes to Consolidated Financial Statements
Amounts in millions of dollars except per share amounts or as otherwise specified.
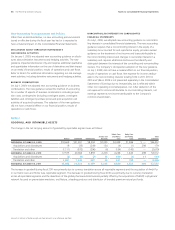
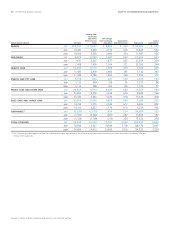
The accumulated benefit obligation for all defined benefit retirement
pension plans was $,436 and $9,708 as of June30,2011 and 2010,
respectively. Pension plans with accumulated benefit obligations in
excess of plan assets and plans with projected benefit obligations in
excess of plan assets consist of the following:
AccumulatedBenefit
ObligationExceedsthe
FairValueofPlan Assets
ProjectedBenefit
ObligationExceedsthe
FairValueofPlan Assets
June30 2010 2010
Projected benefit obligation $6,817 $10,577 $10,650 $11,059
Accumulated benefit obligation 5,923 9,194 8,940 9,531
Fair value of plan assets 2,845 5,900 6,214 6,320
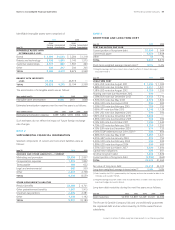
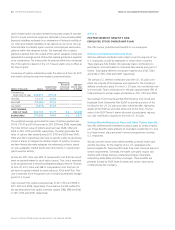
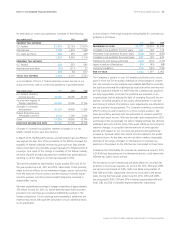
Net Periodic Benefit Cost. Components of the net periodic benefit
cost were as follows:
Pension Benefits Other Retiree Benefits
Years ended June30 2010 2009 2010 2009
Service cost $270 $218 $214$146 $103 $91
Interest cost 588 579 551 270 253 243
Expected return on
planassets (492)(437)(473)(431)(429)(444)
Prior service cost/(credit)
amortization 18 15 14 (18) (21)(23)
Net actuarial loss
amortization 154 91 29 96 20 2
Curtailments,
settlements
andother —3 6 314 —
GROSS BENEFIT
COST/(CREDIT) 538 469 341 66 (60)(131)
Dividends on ESOP
preferred stock —— — (79) (83)(86)
NET PERIODIC BENEFIT
COST/(CREDIT) 538 469 341 (13) (143)(217)
Amounts expected to be amortized from accumulated OCI into net
periodic benefit cost during the year ending June30,2012, are as
follows:
Pension
Benefits
Other
Retiree
Benefits
Net actuarial loss $105 $99
Prior service cost/(credit) 23 (20)
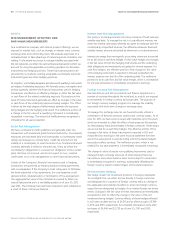
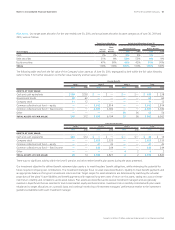
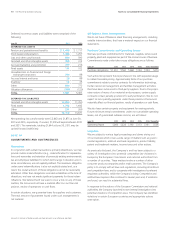
Assumptions. We determine our actuarial assumptions on an annual
basis. These assumptions are weighted to reflect each country that
may have an impact on the cost of providing retirement benefits.
The weighted average assumptions for the defined benefit and other
retiree benefit calculations, as well as assumed health care trend rates,
were as follows:
Pension BenefitsOther Retiree Benefits
Years ended June30 2010 2010
ASSUMPTIONS USED TO
DETERMINE BENEFIT
OBLIGATIONS(1)
Discount rate 5.3% 5.0% 5.7% 5.4%
Rate of compensation increase 3.5% 3.5% ——
ASSUMPTIONS USED TO
DETERMINE NET PERIODIC
BENEFIT COST(2)
Discount rate 5.0% 6.0% 5.4% 6.4%
Expected return on plan assets 7.0% 7.1% 9.2% 9.1%
Rate of compensation increase 3.5% 3.7% ——
ASSUMED HEALTH CARE COST
TREND RATES
Health care cost trend rates
assumed for next year ——8.5% 8.5%
Rate to which the health care
cost trend rate is assumed to
decline (ultimate trend rate)——5.0% 5.0%
Year that the rate reaches the
ultimate trend rate ——2018 2017
(1) Determined as of end of year.
(2) Determined as of beginning of year and adjusted for acquisitions.
Several factors are considered in developing the estimate for the long-
term expected rate of return on plan assets. For the defined benefit
retirement plans, these factors include historical rates of return of
broad equity and bond indices and projected long-term rates of return
obtained from pension investment consultants. The expected long-
term rates of return for plan assets are8–9% for equities and 5–6%
for bonds. For other retiree benefit plans, the expected long-term rate
of return reflects the fact that the assets are comprised primarily of
Company stock. The expected rate of return on Company stock is based
on the long-term projected return of 9.5% and reflects the historical
pattern of favorable returns.
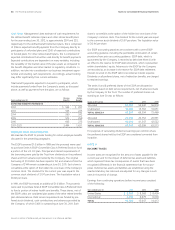
Assumed health care cost trend rates could have a significant effect
on the amounts reported for the other retiree benefit plans. A one-
percentage point change in assumed health care cost trend rates would
have the following effects:
One-Percentage
PointIncrease
One-Percentage
PointDecrease
Effect on total of service and interest cost
components $ 79 $(61)
Effect on postretirement benefit obligation 681 (547)