Proctor and Gamble 2011 Annual Report Download - page 46
Download and view the complete annual report
Please find page 46 of the 2011 Proctor and Gamble annual report below. You can navigate through the pages in the report by either clicking on the pages listed below, or by using the keyword search tool below to find specific information within the annual report.-
 1
1 -
2
-
3
-
4
-
5
-
6
-
7
-
8
-
9
-
10
-
11
-
12
-
13
-
14
-
15
-
16
-
17
-
18
-
19
-
20
-
21
-
22
-
23
-
24
-
25
-
26
-
27
-
28
-
29
-
30
-
31
-
32
-
33
-
34
-
35
-
 36
36 -
 37
37 -
 38
38 -
 39
39 -
 40
40 -
 41
41 -
 42
42 -
 43
43 -
 44
44 -
 45
45 -
 46
46 -
 47
47 -
 48
48 -
 49
49 -
 50
50 -
 51
51 -
 52
52 -
 53
53 -
 54
54 -
 55
55 -
 56
56 -
57
-
58
-
59
-
60
-
61
-
62
-
63
-
64
-
65
-
66
-
67
-
68
-
69
-
70
-
71
-
72
-
73
-
74
-
75
-
76
-
77
-
78
-
79
-
80
-
81
-
82
 |
 |

44 The Procter & Gamble CompanyManagement’s Discussion and Analysis
mid-single digits, led by high single-digit growth in developing regions
behind initiative activity, increased distribution and market growth.
Global market share of the fabric care category increased slightly.
Home Care volume increased double digits due, in part, to the Ambi
Pur acquisition. Organic volume in Home Care was up high single
digits driven mainly by initiative activity, including launches of Gain
hand dishwashing liquid and Febreze Set& Refresh in North America,
and geographic expansion of dish and air care product lines. Global
market share of the home care category was up nearly 1point.
Batteries volume grew mid-single digits primarily due to price reductions
executed through pack count increases in North America, which were
implemented in January 2010, initiative activity in Western Europe and
market growth and distribution expansion in Asia. Global market share
of the batteries category increased more than half a point.
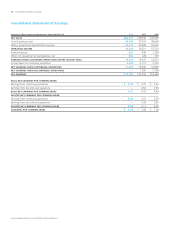
Net earnings decreased 10% to $3.0billion as net sales growth was
more than offset by a 190-basis point decrease in net earnings margin.
Net earnings margin decreased mainly due to gross margin contraction.
SG&A as a percentage of net sales and the effective tax rate also
increased. Gross margin decreased mainly due to higher commodity
costs and unfavorable product mix behind disproportionate growth
of developing regions and mid-tier products, partially offset by manu-
facturing cost savings. SG&A as a percentage of net sales increased
behind higher overhead spending to support growth. The tax rate
increased due to a shift in the geographic mix of earnings to countries
with higher statutory tax rates.
Net sales increased 3% to $23.8billion in 2010 on a 6% increase in
unit volume. Pricing reduced net sales by 1% as the impact of price
reductions to improve consumer value were partially offset by price
increases taken primarily in developing regions to offset currency
devaluations. Mix lowered net sales by 1% due mainly to unfavorable
geographic mix and a shift toward larger size products, which have
lower than segment average selling prices. Unfavorable foreign
exchange reduced net sales by 1%. Organic sales grew 4%. Volume
increased mid-single digits in both developed and developing regions.
Fabric Care volume grew mid-single digits behind new product
launches, price reductions and incremental merchandising activity.
Global market share of the fabric care category was down about half
a point. Home Care volume was up high single digits mainly due to
new product launches, media spending increases and market size
expansion. Global market share of the home care category was up
about half a point versus 2009. Batteries volume increased mid-single
digits primarily due to growth in Greater China, price reductions to
improve consumer value in North America and higher demand from
business customers.
Net earnings increased 10% to $3.3billion in 2010 due to higher net
sales and a 90-basis point increase in net earnings margin. Net earnings
margin increased due to higher gross margin and a lower tax rate,
partially offset by an increase in SG&A as a percentage of net sales.
Gross margin increased mainly due to lower commodity costs and
manufacturing cost savings, while SG&A as a percentage of net sales
increased due to higher marketing spending. The tax rate declined
due to a shift in the geographic mix of earnings to countries with lower
statutory tax rates.
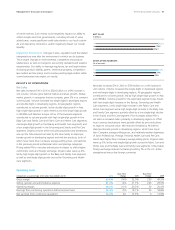
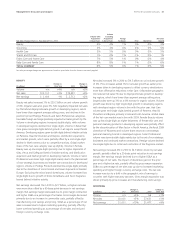
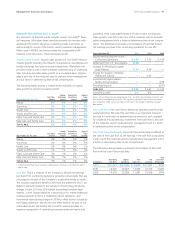
BABY CARE AND FAMILY CARE
($ millions) 2011
Changevs.
Prior Year 2010
Changevs.
Prior Year
Volume n/a +8% n/a +7%
Net sales $15,606 +6%$14,736 +4%
Net earnings $1,978 -3%$2,049 +16%
Baby Care and Family Care net sales increased 6% to $15.6billion on
8% volume growth. Organic sales were up 7%. Mix reduced net sales
by 2% driven mainly by disproportionate growth of mid-tier product
lines, larger package sizes and developing regions, all of which have
lower than segment average selling prices. Pricing added 1% to net
sales growth primarily due to price increases executed in Baby Care
tooffset higher commodity costs and foreign exchange. Unfavorable
foreign exchange negatively impacted net sales by 1%. Volume grew
double digits in developing regions and mid-single digits in developed
regions. Volume in Baby Care was up high single digits primarily due
to double-digit growth in developing regions behind initiative activity,
market size growth and distribution expansion. Global market share
of the baby care category increased over 1point. Volume in Family
Care increased high single digits driven by the continued impact of
initiatives launched in prior periods, with high single-digit growth in
North America. In the U.S., all-outlet share of the family care category
increased half a point.
Net earnings decreased 3% to $2.0billion as sales growth was more
than offset by a 120-basis point reduction in net earnings margin.
Netearnings margin declined mainly due to a lower gross margin,
partially offset by a decrease in SG&A as a percentage of net sales.
The reduction in gross margin was driven by higher commodity costs
and unfavorable product mix, behind disproportionate growth of
mid-tier product lines, larger package sizes and developing regions,
which were only partially offset by the favorable impact of volume
scale leverage and manufacturing cost savings. SG&A as a percentage
of net sales declined due to lower foreign currency exchange costs.
Net sales grew 4% to $14.7billion in 2010 on 7% volume growth.
Pricing was in line with the prior year as the impact of price increases
primarily taken in developing regions to offset local currency devalua-
tions were offset by price reductions to improve consumer value.
Negative mix reduced net sales by 2% driven mainly by disproportionate
growth of mid-tier product lines, large count packs and developing
regions, all of which have lower than segment average selling prices.
Unfavorable foreign exchange reduced net sales by 1%. Organic sales
increased 5%. Volume grew double digits in developing regions and
mid-single digits in developed regions. Volume in Baby Care increased
high single digits behind incremental initiative activity, market size
expansion and price reductions to improve consumer value, primarily
in CEEMEA. Global share of the baby care market was up over half a
point. Volume in Family Care grew high single digits due to increased
merchandising and initiative activity, market growth and price reductions
to improve consumer value.