Proctor and Gamble 2011 Annual Report Download - page 48
Download and view the complete annual report
Please find page 48 of the 2011 Proctor and Gamble annual report below. You can navigate through the pages in the report by either clicking on the pages listed below, or by using the keyword search tool below to find specific information within the annual report.-
 1
1 -
2
-
3
-
4
-
5
-
6
-
7
-
8
-
9
-
10
-
11
-
12
-
13
-
14
-
15
-
16
-
17
-
18
-
19
-
20
-
21
-
22
-
23
-
24
-
25
-
26
-
27
-
28
-
29
-
30
-
31
-
32
-
33
-
34
-
35
-
36
-
37
-
 38
38 -
 39
39 -
 40
40 -
 41
41 -
 42
42 -
 43
43 -
 44
44 -
 45
45 -
 46
46 -
 47
47 -
 48
48 -
 49
49 -
 50
50 -
 51
51 -
 52
52 -
 53
53 -
 54
54 -
 55
55 -
 56
56 -
 57
57 -
 58
58 -
59
-
60
-
61
-
62
-
63
-
64
-
65
-
66
-
67
-
68
-
69
-
70
-
71
-
72
-
73
-
74
-
75
-
76
-
77
-
78
-
79
-
80
-
81
-
82
 |
 |

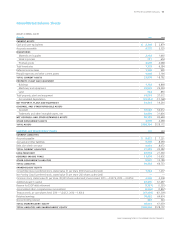
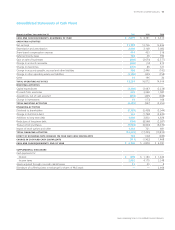
46 The Procter & Gamble CompanyManagement’s Discussion and Analysis
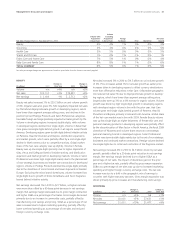
mainly due to an increase in accounts payable, accrued and other
liabilities. Accounts payable, accrued and other liabilities increased
primarily due to increased expenditures to support business growth,
primarily related to the increased marketing investments. Accounts
receivable days were down year over year due mainly to the global
pharmaceuticals divestiture and improved collection efforts. Inventory
contributed to operating cash flow despite growth in the business
from a reduction in days on hand primarily due to inventory manage-
ment improvement efforts. Cash flow from discontinued operations
contributed $ million to operating cash flow.
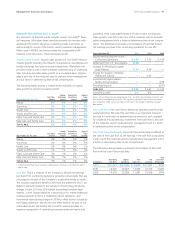
Free Cash Flow.We view free cash flow as an important measure
because it is one factor impacting the amount of cash available for
dividends and discretionary investment. It is defined as operating cash
flow less capital expenditures and is one of the measures used to
evaluate senior management and determine their at-risk compensation.
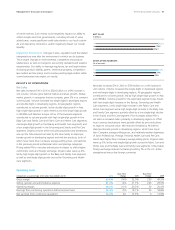
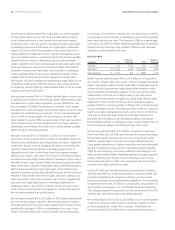
Free cash flow was $9.9billion in 2011, a decrease of 24% versus the
prior year. Free cash flow decreased due to lower operating cash flow
and higher capital spending. Free cash flow productivity, defined as
the ratio of free cash flow to net earnings, was 84% in 2011.
In 2010, free cash flow was $13.0billion an increase of 11% versus the
prior year. Free cash flow increased due to higher operating cash flow
and lower capital spending. Free cash flow productivity was 102% in
2010. This included a negative 23% impact resulting from the global
pharmaceuticals divestiture, which increased net earnings and lowered
operating cash flow due to tax payments on the divestiture gain.
87%
84%
102%
11
09
10
FREE CASH FLOW PRODUCTIVITY
(% of net earnings)
Investing Activities
Net investing activities consumed $3.5billion of cash in 2011 and
$597 million in 2010 mainly due to capital spending and acquisitions,
partially offset by proceeds from asset sales, including $3.0billion in
cash received from the sale of our global pharmaceuticals business
in2010.
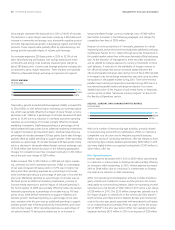
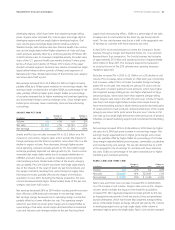
Capital Spending. We view capital spending efficiency as a critical
component of our overall cash management strategy. We manage
capital spending to support our business growth plans and have cost
controls to deliver our cash generation targets. Capital expenditures,
primarily to support capacity expansion, innovation and cost savings,
were $3.3billion in 2011 and $3.1billion in 2010. The increase in capital
spending resulted primarily from capacity expansions. Capital spending
as a percentage of net sales increased 10 basis points to 4.0% in 2011.
Capital spending as a percentage of net sales decreased 30 basis points
to 3.9% in 2010 behind the scale leverage of net sales growth and a
reduction in capital spending.
4.2%
4.0%
.%
11
09
10
CAPITAL SPENDING
(% of net sales)
Acquisitions. Acquisitions used $474 million of cash in 2011 primarily
for the acquisition of Ambi Pur, an air freshener business. In 2010,
acquisitions used $425 million of cash primarily for the acquisition of
Natura, a leading producer and distributor of branded premium
natural pet foods.
Proceeds from Asset Sales. Proceeds from asset sales contributed
$225 million to cash in 2011 mainly due to the sale of our Infasil brand
in Western Europe and Zest brand in North America. In 2010, proceeds
from asset sales contributed $3.1billion to cash mainly due to the sale
of our global pharmaceuticals business.
Financing Activities
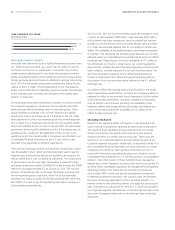
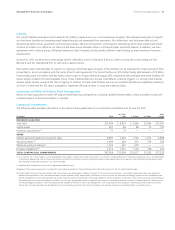
Dividend Payments. Our first discretionary use of cash is dividend
payments. Dividends per common share increased 9% to $1.97 per
share in 2011. Total dividend payments to common and preferred
shareholders were $5.8billion in 2011 and $5.5billion in 2010. The
increase in dividend payments resulted from increases in our quarterly
dividends per share, partially offset by a reduction in the number of
shares outstanding. In April 2011, the Board of Directors declared an
increase in our quarterly dividend from $0.4818 to $0.525 per share
on Common Stock and Series A and B ESOP Convertible ClassA
Preferred Stock. This represents a 9% increase compared to the prior
quarterly dividend and is the 55th consecutive year that our dividend
has increased. We have paid a dividend in every year since our incor-
poration in 1890.
$.64
$1.97
$1.
11
09
10
DIVIDENDS
(per common share)
Long-Term and Short-Term Debt. We maintain debt levels we consider
appropriate after evaluating a number of factors, including cash flow
expectations, cash requirements for ongoing operations, investment
and financing plans (including acquisitions and share repurchase
activities) and the overall cost of capital. Total debt was $32.0billion
in 2011 and $29.8billion in 2010. Our total debt increased in 2011
mainly due to net debt issuances to fund general corporate purposes.
Treasury Purchases. Total share repurchases were $7.0billion in 2011
and $6.0billion in 2010.