Proctor and Gamble 2011 Annual Report Download - page 74
Download and view the complete annual report
Please find page 74 of the 2011 Proctor and Gamble annual report below. You can navigate through the pages in the report by either clicking on the pages listed below, or by using the keyword search tool below to find specific information within the annual report.-
 1
1 -
2
-
3
-
4
-
5
-
6
-
7
-
8
-
9
-
10
-
11
-
12
-
13
-
14
-
15
-
16
-
17
-
18
-
19
-
20
-
21
-
22
-
23
-
24
-
25
-
26
-
27
-
28
-
29
-
30
-
31
-
32
-
33
-
34
-
35
-
36
-
37
-
38
-
39
-
40
-
41
-
42
-
43
-
44
-
45
-
46
-
47
-
48
-
49
-
50
-
51
-
52
-
53
-
54
-
55
-
56
-
57
-
58
-
59
-
60
-
61
-
62
-
63
-
 64
64 -
 65
65 -
 66
66 -
 67
67 -
 68
68 -
 69
69 -
 70
70 -
 71
71 -
 72
72 -
 73
73 -
 74
74 -
 75
75 -
 76
76 -
 77
77 -
 78
78 -
 79
79 -
 80
80 -
 81
81 -
 82
82
 |
 |

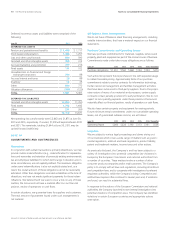
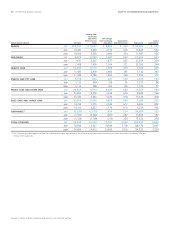
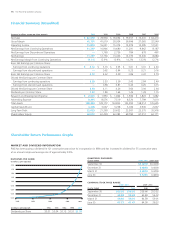
72 The Procter & Gamble CompanyNotes to Consolidated Financial Statements
Amounts in millions of dollars except per share amounts or as otherwise specified.
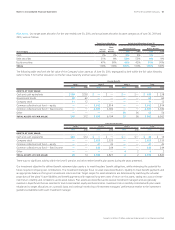
Global Segment Results NetSales
Earnings from
Continuing
Operations
Before Income
Taxes
Net Earnings
from Continuing
Operations
Depreciation
and Amortization Total Assets
Capital
Expenditures
BEAUTY $20,157 $ 3,607 $2,686 $439 $ 12,802 $ 542
2010 19,491 3,648 2,712 503 11,825 534
2009 18,924 3,558 2,664 454 11,987 526
GROOMING 8,025 2,183 1,631 593 21,608 335
2010 7,631 2,007 1,477 625 21,259 259
2009 7,408 1,900 1,359 721 22,205 294
HEALTH CARE 12,033 2,720 1,796 359 7,796 409
2010 11,493 2,809 1,860 385 7,142 383
2009 11,288 2,786 1,835 369 7,206 372
SNACKS AND PET CARE 3,156 356 241 102 1,324 143
2010 3,135 499 326 92 1,237 86
2009 3,114 388 234 100 1,123 72
FABRIC CARE AND HOME CARE 24,837 4,714 3,009 582 11,257 850
2010 23,805 5,076 3,339 604 9,650 766
2009 23,186 4,663 3,032 578 10,419 808
BABY CARE AND FAMILY CARE 15,606 3,181 1,978 549 7,184 912
2010 14,736 3,270 2,049 612 6,406 852
2009 14,103 2,827 1,770 570 6,259 902
CORPORATE() (1,255) (1,572) 456 214 76,383 115
2010 (1,353)(2,262)(817)287 70,653 187
2009 (1,329)(1,709)(214)224 75,634 264
TOTAL COMPANY 82,559 15,189 11,797 2,838 138,354 3,306
2010 78,938 15,047 10,946 3,108 128,172 3,067
2009 76,694 14,413 10,680 3,016 134,833 3,238
(1) The Corporate reportable segment includes the total assets and capital expenditures of the coffee and pharmaceuticals businesses prior to their divestitures in November 2008 and
October 2009, respectively.