Safeway 2012 Annual Report Download - page 20
Download and view the complete annual report
Please find page 20 of the 2012 Safeway annual report below. You can navigate through the pages in the report by either clicking on the pages listed below, or by using the keyword search tool below to find specific information within the annual report.-
 1
1 -
2
-
3
-
4
-
5
-
6
-
7
-
8
-
9
-
 10
10 -
 11
11 -
 12
12 -
 13
13 -
 14
14 -
 15
15 -
 16
16 -
 17
17 -
 18
18 -
 19
19 -
 20
20 -
 21
21 -
 22
22 -
 23
23 -
 24
24 -
 25
25 -
 26
26 -
 27
27 -
 28
28 -
 29
29 -
 30
30 -
31
-
32
-
33
-
34
-
35
-
36
-
37
-
38
-
39
-
40
-
41
-
42
-
43
-
44
-
45
-
46
-
47
-
48
-
49
-
50
-
51
-
52
-
53
-
54
-
55
-
56
-
57
-
58
-
59
-
60
-
61
-
62
-
63
-
64
-
65
-
66
-
67
-
68
-
69
-
70
-
71
-
72
-
73
-
74
-
75
-
76
-
77
-
78
-
79
-
80
-
81
-
82
-
83
-
84
-
85
-
86
-
87
-
88
-
89
-
90
-
91
-
92
-
93
-
94
-
95
-
96
-
97
-
98
-
99
-
100
-
101
-
102
-
103
-
104
-
105
-
106
 |
 |

SAFEWAY INC. AND SUBSIDIARIES
8
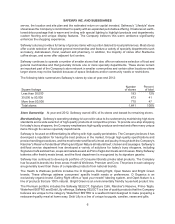
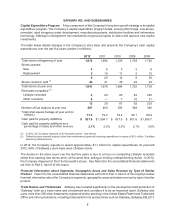
Capital Expenditure Program A key component of the Company’s long-term growth strategy is its capital
expenditure program. The Company’s capital expenditure program funds, among other things, new stores,
remodels, retail shopping center development, manufacturing plants, distribution facilities and information
technology. Safeway’s management has maintained a rigorous program to select and approve new capital
investments.
The table below details changes in the Company’s store base and presents the Company’s cash capital
expenditures over the last five years (dollars in millions):
2012 2011 2010 2009 2008
Total stores at beginning of year 1,678 1,694 1,725 1,739 1,743
Stores opened:
New 46338
Replacement 519 11 5 12
925 14 8 20
Stores closed or sold (1) 46 41 45 22 24
Total stores at year end 1,641 1,678 1,694 1,725 1,739
Remodels completed (2)
Lifestyle remodels 429 60 82 232
Other remodels 8— 7 10 21
12 29 67 92 253
Number of fuel stations at year end 407 400 393 388 382
Total retail square footage at year end (in
millions) 77.6 79.2 79.2 80.1 80.4
Cash paid for property additions $927.6 $ 1,094.7 $ 837.5 $ 851.6 $ 1,595.7
Cash paid for property additions as a
percentage of sales and other revenue 2.1% 2.5% 2.0% 2.1% 3.6%
(1) In 2012, the Company disposed of 25 Genuardi's stores. See Note Q.
(2) Defined as store remodel projects (other than maintenance) generally requiring expenditures in excess of $0.2 million. Excludes
pharmacy refurbishments.
In 2013, the Company expects to spend approximately $1.1 billion for capital expenditures. At year-end
2012, 88% of Safeway’s store base were Lifestyle stores.
The decline in the store count over the last five years is due to a focus on completing Lifestyle remodels
rather than opening new stores while, at the same time, selling or closing underperforming stores. In 2012,
the Company disposed of 25 of its Genuardi's stores. See Note Q to the consolidated financial statements
set forth in Part II, Item 8 of this report.
Financial Information about Segments, Geographic Areas and Sales Revenue by Type of Similar
Product Note N to the consolidated financial statements set forth in Part II, Item 8 of this report provides
financial information about the Company’s segments, geographic areas and sales revenue by type of similar
product.
Trade Names and Trademarks Safeway has invested significantly in the development and protection of
“Safeway” both as a trade name and a trademark and considers it to be an important asset. Safeway also
owns more than 300 other trademarks registered and/or pending in the United States Patent and Trademark
Office and other jurisdictions, including trademarks for its product lines such as Safeway, Safeway SELECT,