Safeway 2012 Annual Report Download - page 55
Download and view the complete annual report
Please find page 55 of the 2012 Safeway annual report below. You can navigate through the pages in the report by either clicking on the pages listed below, or by using the keyword search tool below to find specific information within the annual report.-
 1
1 -
2
-
3
-
4
-
5
-
6
-
7
-
8
-
9
-
10
-
11
-
12
-
13
-
14
-
15
-
16
-
17
-
18
-
19
-
20
-
21
-
22
-
23
-
24
-
25
-
26
-
27
-
28
-
29
-
30
-
31
-
32
-
33
-
34
-
35
-
36
-
37
-
38
-
39
-
40
-
41
-
42
-
43
-
44
-
 45
45 -
 46
46 -
 47
47 -
 48
48 -
 49
49 -
 50
50 -
 51
51 -
 52
52 -
 53
53 -
 54
54 -
 55
55 -
 56
56 -
 57
57 -
 58
58 -
 59
59 -
 60
60 -
 61
61 -
 62
62 -
 63
63 -
 64
64 -
 65
65 -
66
-
67
-
68
-
69
-
70
-
71
-
72
-
73
-
74
-
75
-
76
-
77
-
78
-
79
-
80
-
81
-
82
-
83
-
84
-
85
-
86
-
87
-
88
-
89
-
90
-
91
-
92
-
93
-
94
-
95
-
96
-
97
-
98
-
99
-
100
-
101
-
102
-
103
-
104
-
105
-
106
 |
 |

43
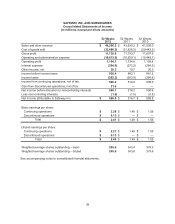
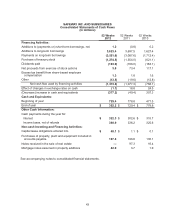
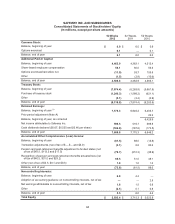
SAFEWAY INC. AND SUBSIDIARIES
Consolidated Statements of Cash Flows
(In millions)
52 Weeks
2012
52 Weeks
2011
52 Weeks
2010
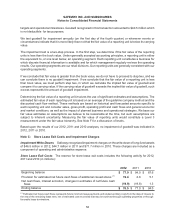
Financing Activities:
Additions to (payments on) short-term borrowings, net 1.2 (0.8) 0.2
Additions to long-term borrowings 3,623.4 3,697.5 1,627.4
Payments on long-term borrowings (3,551.6) (3,087.6) (1,712.4)
Purchase of treasury stock (1,274.5) (1,554.0) (621.1)
Dividends paid (163.9) (188.0) (168.1)
Net proceeds from exercise of stock options 3.8 73.4 117.1
Excess tax benefit from share-based employee
compensation 1.3 1.8 1.6
Other (13.5) (19.6) (12.8)
Net cash flow used by financing activities (1,373.8) (1,077.3) (768.1)
Effect of changes in exchange rates on cash (1.1) 18.8 24.5
(Decrease) increase in cash and equivalents (377.2) (49.4) 307.3
Cash and Equivalents:
Beginning of year 729.4 778.8 471.5
End of year $ 352.2 $ 729.4 $ 778.8
Other Cash Information:
Cash payments during the year for:
Interest $ 322.3 $ 302.6 $ 315.7
Income taxes, net of refunds 380.9 336.2 325.6
Non-cash Investing and Financing Activities:
Capital lease obligations entered into $ 48.1 $ 1.1 $ 0.1
Purchases of property, plant and equipment included in
accounts payable 107.8 198.8 130.1
Notes received in the sale of real estate —97.3 16.4
Mortgage notes assumed in property additions 42.9 3.7 1.9
See accompanying notes to consolidated financial statements.