Safeway 2012 Annual Report Download - page 59
Download and view the complete annual report
Please find page 59 of the 2012 Safeway annual report below. You can navigate through the pages in the report by either clicking on the pages listed below, or by using the keyword search tool below to find specific information within the annual report.-
 1
1 -
2
-
3
-
4
-
5
-
6
-
7
-
8
-
9
-
10
-
11
-
12
-
13
-
14
-
15
-
16
-
17
-
18
-
19
-
20
-
21
-
22
-
23
-
24
-
25
-
26
-
27
-
28
-
29
-
30
-
31
-
32
-
33
-
34
-
35
-
36
-
37
-
38
-
39
-
40
-
41
-
42
-
43
-
44
-
45
-
46
-
47
-
48
-
 49
49 -
 50
50 -
 51
51 -
 52
52 -
 53
53 -
 54
54 -
 55
55 -
 56
56 -
 57
57 -
 58
58 -
 59
59 -
 60
60 -
 61
61 -
 62
62 -
 63
63 -
 64
64 -
 65
65 -
 66
66 -
 67
67 -
 68
68 -
 69
69 -
70
-
71
-
72
-
73
-
74
-
75
-
76
-
77
-
78
-
79
-
80
-
81
-
82
-
83
-
84
-
85
-
86
-
87
-
88
-
89
-
90
-
91
-
92
-
93
-
94
-
95
-
96
-
97
-
98
-
99
-
100
-
101
-
102
-
103
-
104
-
105
-
106
 |
 |
SAFEWAY INC. AND SUBSIDIARIES
Notes to Consolidated Financial Statements
47
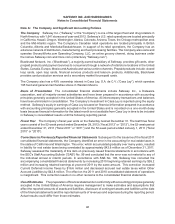
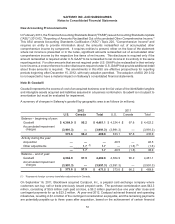
Translation of Foreign Currencies Assets and liabilities of the Company’s Canadian subsidiaries and
Casa Ley are translated into U.S. dollars at year-end rates of exchange, and income and expenses are
translated at average rates during the year. Adjustments resulting from translating financial statements into
U.S. dollars, net of applicable income taxes, are included as a separate component in the statement of
comprehensive income, within accumulated other comprehensive income in the consolidated balance sheets
and within the consolidated statements of stockholders' equity.
Revenue Recognition Retail store sales are recognized at the point of sale. Sales tax is excluded from
revenue. Internet sales are recognized when the merchandise is delivered to the customer. Discounts
provided to customers in connection with loyalty cards are accounted for as a reduction of sales.
Safeway records a deferred revenue liability when it sells Safeway gift cards. Safeway records a sale when
a customer redeems the gift card. Safeway gift cards do not expire. The Company reduces the liability and
increases other revenue for the unused portion of gift cards (“breakage”) after two years, the period at which
redemption is considered remote. Breakage amounts were $9.8 million, $9.2 million and $9.2 million in 2012,
2011 and 2010, respectively.
The Company, through its Blackhawk subsidiary, also sells third-party gift cards through Safeway retail
operations and through other grocery and convenience store retailers. Safeway earns a commission which
is recorded as other revenue when the third-party gift card is sold to the end consumer. The liability for
redemption and potential income for breakage remains with the third-party merchant; therefore, Safeway
does not record redemption or breakage of these gift cards.
Cost of Goods Sold Cost of goods sold includes cost of inventory sold during the period, including purchase
and distribution costs. These costs include inbound freight charges, purchasing and receiving costs,
warehouse inspection costs, warehousing costs and other costs of Safeway’s distribution network. All vendor
allowances are recorded as a reduction of cost of goods when earned. Advertising and promotional expenses
are also included as a component of cost of goods sold. Such costs are expensed in the period the
advertisement occurs. Advertising and promotional expenses totaled $497.0 million in 2012, $491.3 million
in 2011 and $508.7 million in 2010.
Cash and Equivalents Cash and equivalents include short-term investments with original maturities of
less than three months and credit and debit card sales transactions which settle within a few business days
of year end.
Book overdrafts at year-end 2012 and 2011 of $25.8 million and $1.2 million, respectively, are included in
accounts payable.
Receivables Receivables include pharmacy, gift card receivables and miscellaneous trade receivables.
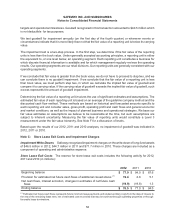
Merchandise Inventories Merchandise inventory of $1,608.4 million at year-end 2012 and $1,607.6
million at year-end 2011 is valued at the lower of cost on a last-in, first-out (“LIFO”) basis or market value. Such
LIFO inventory had a replacement or current cost of $1,678.9 million at year-end 2012 and $1,677.7 million
at year-end 2011. Liquidations of LIFO layers during the three years reported did not have a material effect
on the results of operations. The remaining inventory consists primarily of perishables, pharmacy and fuel
inventory. Perishables are counted every four weeks and are carried at the last purchased cost or the last
four-week average cost, which approximates first-in, first out ("FIFO") cost. Pharmacy and fuel inventories
are carried at the last purchased cost, which approximates FIFO cost. The Company records an inventory
shrink adjustment upon physical counts and also provides for estimated inventory shrink adjustments for
the period between the last physical inventory and each balance sheet date.