Safeway 2012 Annual Report Download - page 93
Download and view the complete annual report
Please find page 93 of the 2012 Safeway annual report below. You can navigate through the pages in the report by either clicking on the pages listed below, or by using the keyword search tool below to find specific information within the annual report.-
 1
1 -
2
-
3
-
4
-
5
-
6
-
7
-
8
-
9
-
10
-
11
-
12
-
13
-
14
-
15
-
16
-
17
-
18
-
19
-
20
-
21
-
22
-
23
-
24
-
25
-
26
-
27
-
28
-
29
-
30
-
31
-
32
-
33
-
34
-
35
-
36
-
37
-
38
-
39
-
40
-
41
-
42
-
43
-
44
-
45
-
46
-
47
-
48
-
49
-
50
-
51
-
52
-
53
-
54
-
55
-
56
-
57
-
58
-
59
-
60
-
61
-
62
-
63
-
64
-
65
-
66
-
67
-
68
-
69
-
70
-
71
-
72
-
73
-
74
-
75
-
76
-
77
-
78
-
79
-
80
-
81
-
82
-
 83
83 -
 84
84 -
 85
85 -
 86
86 -
 87
87 -
 88
88 -
 89
89 -
 90
90 -
 91
91 -
 92
92 -
 93
93 -
 94
94 -
 95
95 -
 96
96 -
 97
97 -
 98
98 -
 99
99 -
 100
100 -
 101
101 -
 102
102 -
 103
103 -
104
-
105
-
106
 |
 |

SAFEWAY INC. AND SUBSIDIARIES
Notes to Consolidated Financial Statements
81
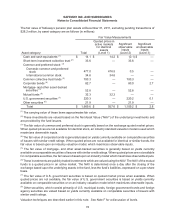
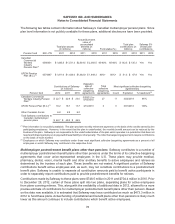
Note O: Income Per Share
Beginning in the third quarter of 2011, the Company computes earnings per share under the two-class
method, which is a method of computing earnings per share when an entity has both common stock and
participating securities. Unvested restricted stock is considered a participating security because it contains
rights to receive nonforfeitable dividends at the same rate as common stock. Under the two-class method,
the calculation of basic and diluted earnings per common share excludes the income attributable to
participating securities. Additionally, the weighted average shares outstanding exclude the impact of
participating securities.
Historically, the Company computed earnings per share under the treasury stock method as the impact of
participating securities did not change earnings per share prior to 2011.
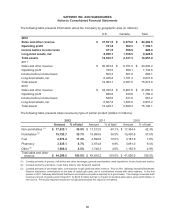
The following table provides reconciliations of net earnings and shares used in calculating income per basic
common share to those used in calculating income per diluted common share.
(In millions, except per-share
amounts) 2012 2011 2010
Diluted Basic Diluted Basic Diluted Basic
Income from continuing
operations, net of tax $566.2 $566.2 $ 518.2 $ 518.2 $ 590.6 $ 590.6
Noncontrolling interests (1.6)(1.6)(1.5) (1.5) (0.8) (0.8)
Distributed and undistributed
earnings allocated to
participating securities (5.4)(5.4)(3.8) (3.8) — —
Income from continuing
operations available to
common stockholders $559.2 $559.2 $ 512.9 $ 512.9 $ 589.8 $ 589.8
Gain from discontinued
operations, net of tax 31.9 31.9 —— ——
Net income available to common
stockholders after earnings
allocated to participating
securities $591.1 $591.1 $ 512.9 $ 512.9 $ 589.8 $ 589.8
Weighted-average common
shares outstanding 245.6 245.6 343.4 343.4 378.3 378.3
Common share equivalents 0.3 0.4 1.3
Weighted-average shares
outstanding 245.9 343.8 379.6
Earnings per common share:
Continuing operations $2.27 $2.28 $ 1.49 $ 1.49 $ 1.55 $ 1.56
Discontinued operations $0.13 $0.13 $—$—$—$—
Total $2.40 $2.41 $ 1.49 $ 1.49 $ 1.55 $ 1.56
Anti-dilutive shares totaling 21.6 million in 2012, 25.1 million in 2011 and 26.4 million in 2010 have been excluded from diluted weighted-
average shares outstanding.
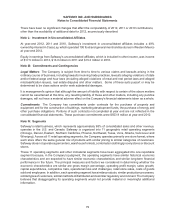
Note P: Guarantees
Safeway applies the accounting guidance for guarantees to the Company’s agreements that contain
guarantee and indemnification clauses. This guidance requires that, upon issuance of a guarantee, the