Safeway 2012 Annual Report Download - page 34
Download and view the complete annual report
Please find page 34 of the 2012 Safeway annual report below. You can navigate through the pages in the report by either clicking on the pages listed below, or by using the keyword search tool below to find specific information within the annual report.-
 1
1 -
2
-
3
-
4
-
5
-
6
-
7
-
8
-
9
-
10
-
11
-
12
-
13
-
14
-
15
-
16
-
17
-
18
-
19
-
20
-
21
-
22
-
23
-
 24
24 -
 25
25 -
 26
26 -
 27
27 -
 28
28 -
 29
29 -
 30
30 -
 31
31 -
 32
32 -
 33
33 -
 34
34 -
 35
35 -
 36
36 -
 37
37 -
 38
38 -
 39
39 -
 40
40 -
 41
41 -
 42
42 -
 43
43 -
 44
44 -
45
-
46
-
47
-
48
-
49
-
50
-
51
-
52
-
53
-
54
-
55
-
56
-
57
-
58
-
59
-
60
-
61
-
62
-
63
-
64
-
65
-
66
-
67
-
68
-
69
-
70
-
71
-
72
-
73
-
74
-
75
-
76
-
77
-
78
-
79
-
80
-
81
-
82
-
83
-
84
-
85
-
86
-
87
-
88
-
89
-
90
-
91
-
92
-
93
-
94
-
95
-
96
-
97
-
98
-
99
-
100
-
101
-
102
-
103
-
104
-
105
-
106
 |
 |

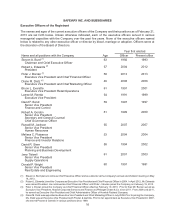
SAFEWAY INC. AND SUBSIDIARIES
22
Item 7. Management’s Discussion and Analysis of Financial Condition and Results of
Operations
The last three fiscal years consist of the 52-week period ended December 29, 2012 (“fiscal 2012” or “2012”),
the 52-week period ended December 31, 2011 (“fiscal 2011” or “2011”) and the 52-week period ended
January 1, 2011 (“fiscal 2010” or “2010”).
Results of Operations
Management Overview The Company’s results of operations can be affected by economic conditions such
as macroeconomic conditions, credit market conditions and the level of consumer confidence. We believe
that consumer confidence remains at low levels, which can lead to reduced spending and to some consumers
trading down to discounters for grocery items. We believe that such changes in consumer spending have
adversely affected Safeway’s results of operations. The Company is responding to this challenging
environment with new marketing programs, such as just for U™, a continuing focus on cost control and
new business initiatives.
Safeway’s income before income taxes declined $53.7 million to $828.4 million in 2012 from $882.1 million
in 2011. This decline was primarily the result of higher interest expense, additional marketing expense and
higher corporate pension expense. Interest expense in 2012 was impacted by higher average borrowings,
partly offset by lower average interest rates. Additional marketing expenses were incurred in 2012 to roll out
the just for U digital marketing program, a platform which downloads personalized pricing and digital coupons
to the Safeway Club Card.
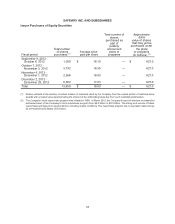
Total debt increased $163.5 million in 2012 compared to 2011. During the first half of 2012, Safeway increased
debt to repurchase approximately 57.6 million shares of its common stock under its stock repurchase program
at an aggregate price, including commissions, of $1,240.3 million. In the second half of 2012, the Company
utilized free cash flow to reduce debt. In 2013, Safeway intends to continue to reduce debt, which the
Company expects will reduce interest expense.
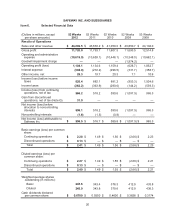
Net Income Safeway earned net income of $596.5 million ($2.40 per diluted share) in 2012, net income of
$516.7 million ($1.49 per diluted share) in 2011 and net income of $589.8 million ($1.55 per diluted share)
in 2010. Fiscal 2012 included a $46.5 million gain from legal settlements (recorded within Operating and
Administrative Expense) and a gain on discontinued operations of $31.9 million, net of tax, as discussed
below. Repurchases of common stock during 2012, net of incremental interest expense, increased diluted
earnings per share by $0.32. Fiscal 2011 included a $98.9 million tax charge resulting from the decision to
repatriate $1.1 billion from Safeway's wholly-owned Canadian subsidiary.
Discontinued Operations In January 2012, Safeway announced the planned sale or closure of its
Genuardi’s stores, located in the eastern United States. These transactions were completed during 2012
with cash proceeds of $107.0 million and a pre-tax gain of $52.4 million ($31.9 million after tax).
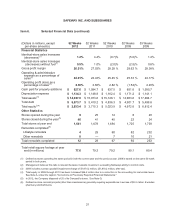
Sales Identical-store sales increases (decreases) for the past three fiscal years were as follows:
2012 2011 2010
Including fuel 1.2% 4.4% (0.7)%
Excluding fuel 0.5% 1.0% (2.0)%
Sales increased 1.3% to $44.2 billion in 2012 from $43.6 billion in 2011. Fuel sales increased $378 million
in 2012, as a result of the average retail price per gallon of fuel increasing 2.2% and gallons sold increasing
5.9%. Other revenue from gift and prepaid card sales increased $204 million. Identical-store sales, excluding
fuel, increased 0.5%, or $167 million, primarily due to inflation. New stores, net of store closures, increased
sales $154 million. These increases were partly offset by a $64 million decrease in sales from the change