Safeway 2012 Annual Report Download - page 82
Download and view the complete annual report
Please find page 82 of the 2012 Safeway annual report below. You can navigate through the pages in the report by either clicking on the pages listed below, or by using the keyword search tool below to find specific information within the annual report.-
 1
1 -
2
-
3
-
4
-
5
-
6
-
7
-
8
-
9
-
10
-
11
-
12
-
13
-
14
-
15
-
16
-
17
-
18
-
19
-
20
-
21
-
22
-
23
-
24
-
25
-
26
-
27
-
28
-
29
-
30
-
31
-
32
-
33
-
34
-
35
-
36
-
37
-
38
-
39
-
40
-
41
-
42
-
43
-
44
-
45
-
46
-
47
-
48
-
49
-
50
-
51
-
52
-
53
-
54
-
55
-
56
-
57
-
58
-
59
-
60
-
61
-
62
-
63
-
64
-
65
-
66
-
67
-
68
-
69
-
70
-
71
-
 72
72 -
 73
73 -
 74
74 -
 75
75 -
 76
76 -
 77
77 -
 78
78 -
 79
79 -
 80
80 -
 81
81 -
 82
82 -
 83
83 -
 84
84 -
 85
85 -
 86
86 -
 87
87 -
 88
88 -
 89
89 -
 90
90 -
 91
91 -
 92
92 -
93
-
94
-
95
-
96
-
97
-
98
-
99
-
100
-
101
-
102
-
103
-
104
-
105
-
106
 |
 |

SAFEWAY INC. AND SUBSIDIARIES
Notes to Consolidated Financial Statements
70
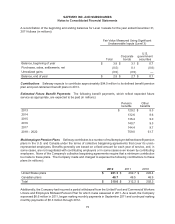
The investment policy also emphasizes the following key objectives: (1) maintain a diversified portfolio among
asset classes and investment styles; (2) maintain an acceptable level of risk in pursuit of long-term economic
benefit; (3) maximize the opportunity for value-added returns from active investment management while
establishing investment guidelines and monitoring procedures for each investment manager to ensure the
characteristics of the portfolio are consistent with the original investment mandate; and (4) maintain adequate
controls over administrative costs.
Expected return on pension plan assets is based on historical experience of the Company’s portfolio and
the review of projected returns by asset class on broad, publicly traded equity and fixed-income indices, as
well as target asset allocation. Safeway’s target asset allocation mix is designed to meet the Company’s
long-term pension requirements.
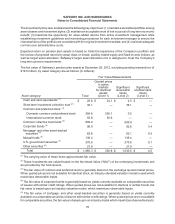
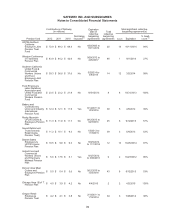
The fair value of Safeway’s pension plan assets at December 29, 2012, excluding pending transactions of
$19.6 million, by asset category are as follows (in millions):
Fair Value Measurements
Asset category: Total
Quoted prices
in active
markets
for identical
assets
(Level 1)
Significant
observable
inputs
(Level 2)
Significant
unobservable
inputs
(Level 3)
Cash and cash equivalents (1) $28.6 $ 24.1 $ 4.5 $ —
Short-term investment collective trust (2) 36.1 — 36.1 —
Common and preferred stock: (3)
Domestic common and preferred stock 256.6 256.1 0.5 —
International common stock 50.6 50.6 — —
Common collective trust funds (2) 899.9 —899.9 —
Corporate bonds (4) 96.0 — 92.6 3.4
Mortgage- and other asset-backed
securities (5) 62.6 — 62.1 0.5
Mutual funds (6) 136.4 —136.4 —
U.S. government securities (7) 270.6 —270.5 0.1
Other securities (8) 27.9 — 27.9 —
Total $1,865.3 $ 330.8 $ 1,530.5 $ 4.0
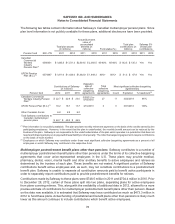
(1) The carrying value of these items approximates fair value.
(2) These investments are valued based on the Net Asset Value (“NAV”) of the underlying investments and
are provided by the fund issuers.
(3) The fair value of common and preferred stock is generally based on the exchange quoted market prices.
When quoted prices are not available for identical stock, an industry standard valuation model is used which
maximizes observable inputs.
(4) The fair value of corporate bonds is generally based on yields currently available on comparable securities
of issuers with similar credit ratings. When quoted prices are not available for identical or similar bonds, the
fair value is based upon an industry valuation model, which maximizes observable inputs.
(5) The fair value of mortgage- and other asset-backed securities is generally based on yields currently
available on comparable securities of issuers with similar credit ratings. When quoted prices are not available
for comparable securities, the fair value is based upon an industry model which maximizes observable inputs.