Safeway 2012 Annual Report Download - page 3
Download and view the complete annual report
Please find page 3 of the 2012 Safeway annual report below. You can navigate through the pages in the report by either clicking on the pages listed below, or by using the keyword search tool below to find specific information within the annual report.-
 1
1 -
 2
2 -
 3
3 -
 4
4 -
 5
5 -
 6
6 -
 7
7 -
 8
8 -
 9
9 -
 10
10 -
 11
11 -
 12
12 -
 13
13 -
 14
14 -
15
-
16
-
17
-
18
-
19
-
20
-
21
-
22
-
23
-
24
-
25
-
26
-
27
-
28
-
29
-
30
-
31
-
32
-
33
-
34
-
35
-
36
-
37
-
38
-
39
-
40
-
41
-
42
-
43
-
44
-
45
-
46
-
47
-
48
-
49
-
50
-
51
-
52
-
53
-
54
-
55
-
56
-
57
-
58
-
59
-
60
-
61
-
62
-
63
-
64
-
65
-
66
-
67
-
68
-
69
-
70
-
71
-
72
-
73
-
74
-
75
-
76
-
77
-
78
-
79
-
80
-
81
-
82
-
83
-
84
-
85
-
86
-
87
-
88
-
89
-
90
-
91
-
92
-
93
-
94
-
95
-
96
-
97
-
98
-
99
-
100
-
101
-
102
-
103
-
104
-
105
-
106
 |
 |
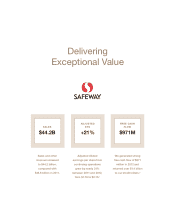
Sales and other
revenue increased
to $44.2 billion,
compared with
$43.6 billion in 2011.
Adjusted diluted
earnings per share from
continuing operations
grew by nearly 21%
between 2011 and 2012,
from $1.78 to $2.15.1
We generated strong
IUHHFDVKñRZRI
million in 2012 and
returned over $1.4 billon
to our stockholders.2
Delivering
Exceptional Value
$44.2B +21% $971M
SALES
ADJUSTED
EPS
FREE CASH
FLOW