Safeway 2012 Annual Report Download - page 39
Download and view the complete annual report
Please find page 39 of the 2012 Safeway annual report below. You can navigate through the pages in the report by either clicking on the pages listed below, or by using the keyword search tool below to find specific information within the annual report.-
 1
1 -
2
-
3
-
4
-
5
-
6
-
7
-
8
-
9
-
10
-
11
-
12
-
13
-
14
-
15
-
16
-
17
-
18
-
19
-
20
-
21
-
22
-
23
-
24
-
25
-
26
-
27
-
28
-
 29
29 -
 30
30 -
 31
31 -
 32
32 -
 33
33 -
 34
34 -
 35
35 -
 36
36 -
 37
37 -
 38
38 -
 39
39 -
 40
40 -
 41
41 -
 42
42 -
 43
43 -
 44
44 -
 45
45 -
 46
46 -
 47
47 -
 48
48 -
 49
49 -
50
-
51
-
52
-
53
-
54
-
55
-
56
-
57
-
58
-
59
-
60
-
61
-
62
-
63
-
64
-
65
-
66
-
67
-
68
-
69
-
70
-
71
-
72
-
73
-
74
-
75
-
76
-
77
-
78
-
79
-
80
-
81
-
82
-
83
-
84
-
85
-
86
-
87
-
88
-
89
-
90
-
91
-
92
-
93
-
94
-
95
-
96
-
97
-
98
-
99
-
100
-
101
-
102
-
103
-
104
-
105
-
106
 |
 |

SAFEWAY INC. AND SUBSIDIARIES
27
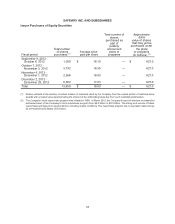
Sensitivity to changes in the major assumptions for Safeway's pension plans are as follows (in millions):
United States Canada
Percentage
point
change
Projected benefit
obligation
decrease
(increase)
Expense
decrease
(increase)
Projected benefit
obligation
decrease
(increase)
Expense
decrease
(increase)
Expected return on assets +1 pt $ — $ 13.0 $ — $ 3.5
-1 pt $ — $ (13.0) $ — $ (3.5)
Discount rate +1 pt $ 268.2 $ 28.8 $ 79.4 $ 6.2
-1 pt $ (338.6) $ (36.1) $ (92.9) $ (6.3)
Cash contributions to the Company’s pension and post-retirement benefit plans are expected to total
approximately $94 million in 2013 and totaled $159.5 million in 2012, $176.2 million in 2011 and $17.7 million
in 2010.
Income Tax Contingencies The Company is subject to periodic audits by the Internal Revenue Service
and other foreign, state and local taxing authorities. These audits may challenge certain of the Company’s
tax positions such as the timing and amount of income and deductions and the allocation of taxable income
to various tax jurisdictions. The Company evaluates its tax positions and establishes liabilities in accordance
with the applicable accounting guidance on uncertainty in income taxes. These tax uncertainties are reviewed
as facts and circumstances change and are adjusted accordingly. This requires significant management
judgment in estimating final outcomes. Actual results could materially differ from these estimates and could
significantly affect the Company’s effective tax rate and cash flows in future years. Note J to the consolidated
financial statements set forth in Part II, Item 8 of this report provides additional information on income taxes.
Liquidity and Financial Resources
Net cash flow from operating activities was $1,569.7 million in 2012, $2,023.6 million in 2011 and $1,849.7
million in 2010. Net cash flow from operating activities declined in 2012 compared to 2011 primarily due to
a greater use of cash flow for working capital which was largely calender driven.
Blackhawk receives significant cash inflow from the sale of third-party gift cards late in the fourth quarter of
the year and remits the majority of the cash, less commissions, to the card partners early in the first quarter
of the following year. Changes in payables related to third-party gift cards, net of receivables, was a source
of cash of $26.4 million in 2012 compared to a source of cash of $293.6 million in 2011, primarily as a result
of the timing of holiday sales and a shift towards payables with shorter payment terms.
The decline in the financial markets during 2008 resulted in a substantial reduction in the fair value of the
retirement plan assets. Since 2008, the financial markets have improved. Despite the improvement, the
projected benefit obligation exceeds the fair value of the plan assets. As a result, cash contributions to
pension and post-retirement plans increased from $17.7 million in 2010 to approximately $176.2 million in
2011 and $159.5 million in 2012. Cash contributions are expected to decline to approximately $94.0 million
in 2013 due primarily to the impact of the Pension Funding Stabilization legislation which increased the
discount rate used to determine pension funding (but which had no effect on pension expense).
Net cash flow used by investing activities, which consists principally of cash paid for property additions, was
$572.0 million in 2012, $1,014.5 million in 2011 and $798.8 million in 2010. Net cash flow used by investing
activities declined in 2012 compared to 2011 primarily as a result of higher capital expenditures in 2011,
higher proceeds from the sale of property in 2012 and net cash proceeds from discontinued operations in
2012. Net cash flow used by investing activities increased in 2011 compared to 2010 primarily as a result
of higher capital expenditures, partly offset by higher proceeds from the sale of property in 2011.