Safeway 2012 Annual Report Download - page 36
Download and view the complete annual report
Please find page 36 of the 2012 Safeway annual report below. You can navigate through the pages in the report by either clicking on the pages listed below, or by using the keyword search tool below to find specific information within the annual report.-
 1
1 -
2
-
3
-
4
-
5
-
6
-
7
-
8
-
9
-
10
-
11
-
12
-
13
-
14
-
15
-
16
-
17
-
18
-
19
-
20
-
21
-
22
-
23
-
24
-
25
-
 26
26 -
 27
27 -
 28
28 -
 29
29 -
 30
30 -
 31
31 -
 32
32 -
 33
33 -
 34
34 -
 35
35 -
 36
36 -
 37
37 -
 38
38 -
 39
39 -
 40
40 -
 41
41 -
 42
42 -
 43
43 -
 44
44 -
 45
45 -
 46
46 -
47
-
48
-
49
-
50
-
51
-
52
-
53
-
54
-
55
-
56
-
57
-
58
-
59
-
60
-
61
-
62
-
63
-
64
-
65
-
66
-
67
-
68
-
69
-
70
-
71
-
72
-
73
-
74
-
75
-
76
-
77
-
78
-
79
-
80
-
81
-
82
-
83
-
84
-
85
-
86
-
87
-
88
-
89
-
90
-
91
-
92
-
93
-
94
-
95
-
96
-
97
-
98
-
99
-
100
-
101
-
102
-
103
-
104
-
105
-
106
 |
 |
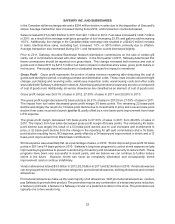
SAFEWAY INC. AND SUBSIDIARIES
24
Slotting allowances are a very small portion of total allowances. With slotting allowances, the vendor
reimburses Safeway for the cost of placing new product on the shelf. Safeway has no obligation or commitment
to keep the product on the shelf for a minimum period.
Contract allowances make up the remainder of all allowances. Under a typical contract allowance, a vendor
pays Safeway to keep product on the shelf for a minimum period of time or when volume thresholds are
achieved.
Promotional and slotting allowances are accounted for as a reduction in the cost of purchased inventory and
are recognized when the related inventory is sold. Contract allowances are recognized as a reduction in the
cost of goods sold as volume thresholds are achieved or through the passage of time.
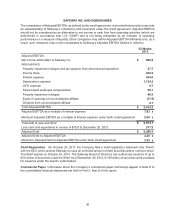
Operating and Administrative Expense Operating and administrative expense consists primarily of store
occupancy costs and backstage expenses, which, in turn, consist primarily of wages, employee benefits,
rent, depreciation and utilities.
Operating and administrative expense was 24.01% of sales in 2012 compared to 24.43% of sales in 2011
and 25.45% in 2010.
Operating and administrative expense margin decreased 42 basis points to 24.01% of sales in 2012 from
24.43% of sales in 2011. Higher fuel sales in 2012 decreased operating and administrative expense margin
by 16 basis points. The remaining 26 basis-point decline was due primarily to a 12 basis-point basis-point
decline from gains related to legal settlements and a 12 basis-point decline from lower labor costs.
Operating and administrative expense margin decreased 102 basis points to 24.43% of sales in 2011 from
25.45% of sales in 2010. Higher fuel sales in 2011 decreased operating and administrative expense margin
by 69 basis points. The impact from the change related to gift card commissions reduced operating and
administrative expense 28 basis points, and net gains on property dispositions reduced operating and
administrative expense 17 basis points.
Gain (Loss) on Property Dispositions Operating and administrative expense included a net gain on property
dispositions of $79.1 million in 2012. Operating and administrative expense included a net gain of $65.6
million in 2011, primarily consisting of a gain of $47.1 million on the sale of a distribution center in Burnaby,
British Columbia and a net gain of $27.5 million in 2010.
Interest Expense Interest expense was $304.0 million in 2012, compared to $272.2 million in 2011 and
$298.5 million in 2010. The increase in 2012 was due to higher average borrowings, partly offset by lower
average interest rates. Interest expense decreased in 2011 primarily due to a combination of lower average
borrowings and a lower average interest rate. Average borrowings were $6,467.6 million, $5,126.8 million,
$5,276.6 million in 2012, 2011 and 2010, respectively. Average interest rates were 4.70%, 5.31% and 5.66%
in 2012, 2011 and 2010, respectively.
Other Income Other income consists primarily of interest income and equity in earnings from Safeway’s
unconsolidated affiliate. Interest income was $10.3 million in 2012, $6.7 million in 2011 and $4.4 million in
2010. Equity in earnings of unconsolidated affiliate was $17.5 million in 2012, $13.0 million in 2011 and $15.3
million in 2010.
Income Taxes Income tax expense was $262.2 million, or 31.7% of pre-tax income, in 2012. In 2011,
Safeway had income tax expense of $363.9 million, or 41.3% of pre-tax income. Fiscal 2011 included a
$98.9 million tax charge resulting from the decision to repatriate $1.1 billion from Safeway's wholly-owned
Canadian subsidiary.