Safeway 2012 Annual Report Download - page 81
Download and view the complete annual report
Please find page 81 of the 2012 Safeway annual report below. You can navigate through the pages in the report by either clicking on the pages listed below, or by using the keyword search tool below to find specific information within the annual report.-
 1
1 -
2
-
3
-
4
-
5
-
6
-
7
-
8
-
9
-
10
-
11
-
12
-
13
-
14
-
15
-
16
-
17
-
18
-
19
-
20
-
21
-
22
-
23
-
24
-
25
-
26
-
27
-
28
-
29
-
30
-
31
-
32
-
33
-
34
-
35
-
36
-
37
-
38
-
39
-
40
-
41
-
42
-
43
-
44
-
45
-
46
-
47
-
48
-
49
-
50
-
51
-
52
-
53
-
54
-
55
-
56
-
57
-
58
-
59
-
60
-
61
-
62
-
63
-
64
-
65
-
66
-
67
-
68
-
69
-
70
-
 71
71 -
 72
72 -
 73
73 -
 74
74 -
 75
75 -
 76
76 -
 77
77 -
 78
78 -
 79
79 -
 80
80 -
 81
81 -
 82
82 -
 83
83 -
 84
84 -
 85
85 -
 86
86 -
 87
87 -
 88
88 -
 89
89 -
 90
90 -
 91
91 -
92
-
93
-
94
-
95
-
96
-
97
-
98
-
99
-
100
-
101
-
102
-
103
-
104
-
105
-
106
 |
 |

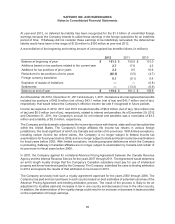
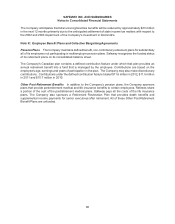
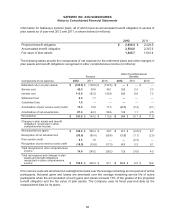
SAFEWAY INC. AND SUBSIDIARIES
Notes to Consolidated Financial Statements
69
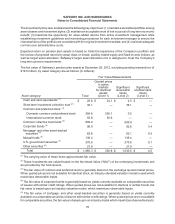
The actuarial assumptions used to determine year-end projected benefit obligations for pension plans were
as follows:
2012 2011 2010
Discount rate:
United States plans 4.20% 4.94% 5.69%
Canadian plans 4.00% 4.25% 5.00%
Combined weighted-average rate 4.16% 4.80% 5.55%
Rate of compensation increase:
United States plans 3.00% 3.00% 3.00%
Canadian plans 2.75% 2.75% 2.50%
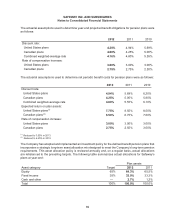
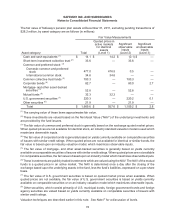
The actuarial assumptions used to determine net periodic benefit costs for pension plans were as follows:
2012 2011 2010
Discount rate:
United States plans 4.94% 5.69% 6.20%
Canadian plans 4.25% 5.00% 5.80%
Combined weighted-average rate 4.80% 5.55% 6.10%
Expected return on plan assets:
United States plans(1) 7.75% 8.50% 8.50%
Canadian plans(2) 6.50% 6.75% 7.00%
Rate of compensation increase:
United States plans 3.00% 3.00% 3.00%
Canadian plans 2.75% 2.50% 3.00%
(1) Reduced to 7.50% in 2013.
(2) Reduced to 6.25% in 2013.
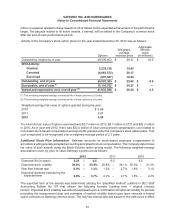
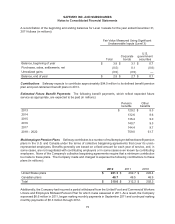
The Company has adopted and implemented an investment policy for the defined benefit pension plans that
incorporates a strategic long-term asset allocation mix designed to meet the Company’s long-term pension
requirements. This asset allocation policy is reviewed annually and, on a regular basis, actual allocations
are rebalanced to the prevailing targets. The following table summarizes actual allocations for Safeway’s
plans at year-end:
Plan assets
Asset category Target 2012 2011
Equity 65% 64.3% 65.5%
Fixed income 35% 33.0% 33.3%
Cash and other — 2.7% 1.2%
Total 100% 100.0% 100.0%