Safeway 2012 Annual Report Download - page 4
Download and view the complete annual report
Please find page 4 of the 2012 Safeway annual report below. You can navigate through the pages in the report by either clicking on the pages listed below, or by using the keyword search tool below to find specific information within the annual report.-
 1
1 -
 2
2 -
 3
3 -
 4
4 -
 5
5 -
 6
6 -
 7
7 -
 8
8 -
 9
9 -
 10
10 -
 11
11 -
 12
12 -
 13
13 -
 14
14 -
 15
15 -
16
-
17
-
18
-
19
-
20
-
21
-
22
-
23
-
24
-
25
-
26
-
27
-
28
-
29
-
30
-
31
-
32
-
33
-
34
-
35
-
36
-
37
-
38
-
39
-
40
-
41
-
42
-
43
-
44
-
45
-
46
-
47
-
48
-
49
-
50
-
51
-
52
-
53
-
54
-
55
-
56
-
57
-
58
-
59
-
60
-
61
-
62
-
63
-
64
-
65
-
66
-
67
-
68
-
69
-
70
-
71
-
72
-
73
-
74
-
75
-
76
-
77
-
78
-
79
-
80
-
81
-
82
-
83
-
84
-
85
-
86
-
87
-
88
-
89
-
90
-
91
-
92
-
93
-
94
-
95
-
96
-
97
-
98
-
99
-
100
-
101
-
102
-
103
-
104
-
105
-
106
 |
 |

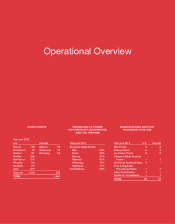
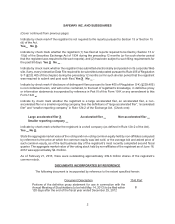
Operational Overview
MANUFACTURING AND FOOD
PROCESSING FACILITIES
STORE COUNTS PERCENTAGE OF STORES
WITH SPECIALTY DEPARTMENTS
AND FUEL STATIONS
Year-end 2012
U.S. Canada
'HQYHU $OEHUWD
Dominick’s 72 Vancouver 72
Eastern 127 Winnipeg 55
NorCal 268
Northwest 313
Phoenix 115
Randalls 110
Vons 277
Subtotal 1,418 223
TOTAL 1,641
Year-end 2012
Specialty Departments
'HOL
)ORUDO
%DNHU\
Seafood 81%
3KDUPDF\
Starbucks 71%
Fuel Stations 25%
Year-end 2012 U.S. Canada
Milk Plants 6 3
Bakery Plants 6 2
Ice Cream Plants 2 2
Cheese & Meat Packing
Plants – 1
Soft Drink Bottling Plants 4 –
Fruit & Vegetable
Processing Plants 1 3
Cake Commissary 1 –
Sandwich Commissary – 1
TOTAL 20 12