Safeway 2012 Annual Report Download - page 74
Download and view the complete annual report
Please find page 74 of the 2012 Safeway annual report below. You can navigate through the pages in the report by either clicking on the pages listed below, or by using the keyword search tool below to find specific information within the annual report.-
 1
1 -
2
-
3
-
4
-
5
-
6
-
7
-
8
-
9
-
10
-
11
-
12
-
13
-
14
-
15
-
16
-
17
-
18
-
19
-
20
-
21
-
22
-
23
-
24
-
25
-
26
-
27
-
28
-
29
-
30
-
31
-
32
-
33
-
34
-
35
-
36
-
37
-
38
-
39
-
40
-
41
-
42
-
43
-
44
-
45
-
46
-
47
-
48
-
49
-
50
-
51
-
52
-
53
-
54
-
55
-
56
-
57
-
58
-
59
-
60
-
61
-
62
-
63
-
 64
64 -
 65
65 -
 66
66 -
 67
67 -
 68
68 -
 69
69 -
 70
70 -
 71
71 -
 72
72 -
 73
73 -
 74
74 -
 75
75 -
 76
76 -
 77
77 -
 78
78 -
 79
79 -
 80
80 -
 81
81 -
 82
82 -
 83
83 -
 84
84 -
85
-
86
-
87
-
88
-
89
-
90
-
91
-
92
-
93
-
94
-
95
-
96
-
97
-
98
-
99
-
100
-
101
-
102
-
103
-
104
-
105
-
106
 |
 |

SAFEWAY INC. AND SUBSIDIARIES
Notes to Consolidated Financial Statements
62
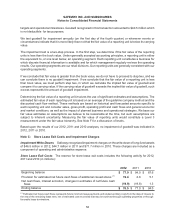
at the time the options were granted, using U.S. constant maturities over the expected life of the
option. Expected dividend yield is based on Safeway’s dividend policy at the time the options were granted.
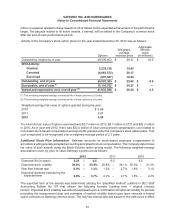
The following table summarizes information about unvested Safeway restricted stock as of December 29,
2012:
Awards
Weighted-
average
grant
date
fair value
Unvested, beginning of year 2,525,205 $ 22.70
Granted 695,816 20.22
Vested (658,561) 22.15
Canceled (149,630) 22.28
Unvested, end of year 2,412,830 $ 22.16
At the date of vest, the fair value of restricted stock awards vested during the year was $14.2 million in 2012,
$6.6 million in 2011 and $2.5 million in 2010. At December 29, 2012, there was $37.1 million of total
unrecognized compensation cost related to non-vested restricted stock awards. The cost is expected to be
recognized over a weighted average period of 1.6 years.
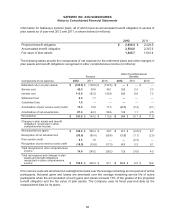
Total share-based compensation expenses recognized as a component of operating and administrative
expense is as follows (in millions):
2012 2011 2010
Share-based compensation expense $ 55.1 $ 50.0 $ 55.5
Income tax benefit (20.8) (18.8) (20.8)
Share-based compensation expense recognized in
earnings, net of tax $ 34.3 $ 31.2 $ 34.7
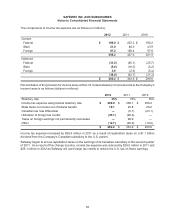
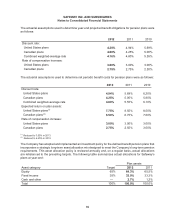
Note J: Taxes on Income
The components of income before income tax expense are as follows (in millions):
2012 2011 2010
Domestic $ 471.5 $ 500.3 $ 549.6
Foreign 356.9 381.8 331.6
$ 828.4 $ 882.1 $ 881.2