Safeway 2012 Annual Report Download - page 83
Download and view the complete annual report
Please find page 83 of the 2012 Safeway annual report below. You can navigate through the pages in the report by either clicking on the pages listed below, or by using the keyword search tool below to find specific information within the annual report.-
 1
1 -
2
-
3
-
4
-
5
-
6
-
7
-
8
-
9
-
10
-
11
-
12
-
13
-
14
-
15
-
16
-
17
-
18
-
19
-
20
-
21
-
22
-
23
-
24
-
25
-
26
-
27
-
28
-
29
-
30
-
31
-
32
-
33
-
34
-
35
-
36
-
37
-
38
-
39
-
40
-
41
-
42
-
43
-
44
-
45
-
46
-
47
-
48
-
49
-
50
-
51
-
52
-
53
-
54
-
55
-
56
-
57
-
58
-
59
-
60
-
61
-
62
-
63
-
64
-
65
-
66
-
67
-
68
-
69
-
70
-
71
-
72
-
 73
73 -
 74
74 -
 75
75 -
 76
76 -
 77
77 -
 78
78 -
 79
79 -
 80
80 -
 81
81 -
 82
82 -
 83
83 -
 84
84 -
 85
85 -
 86
86 -
 87
87 -
 88
88 -
 89
89 -
 90
90 -
 91
91 -
 92
92 -
 93
93 -
94
-
95
-
96
-
97
-
98
-
99
-
100
-
101
-
102
-
103
-
104
-
105
-
106
 |
 |

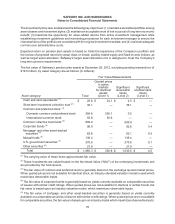
SAFEWAY INC. AND SUBSIDIARIES
Notes to Consolidated Financial Statements
71
(6) These investments are publicly traded investments which are valued using the NAV. The NAV of the mutual
funds is a quoted price in an active market. The NAV is determined once a day after the closing of the
exchange based upon the underlying assets in the fund, less the fund’s liabilities, expressed on a per-share
basis.
(7) The fair value of U.S. government securities is based on quoted market prices when available. When
quoted prices are not available, the fair value of U.S. government securities is based on yields currently
available on comparable securities or on an industry valuation model which maximizes observable inputs.
(8) Other securities, which consist primarily of U.S. municipal bonds, foreign government bonds and foreign
agency securities are valued based on yields currently available on comparable securities of issuers with
similar credit ratings.
Also included in Other Securities are exchange-traded derivatives that are valued based on quoted prices
in an active market for identical derivatives assets and liabilities. Non-exchange-traded derivatives are valued
using industry valuation models, which maximize observable inputs, such as interest-rate yield curve data,
foreign exchange rates, and applicable spot and forward rates.
See Note F for a discussion of levels.
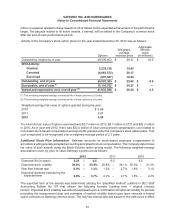
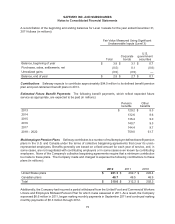
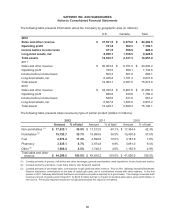
A reconciliation of the beginning and ending balances for Level 3 assets for the year ended December 29,
2012 follows (in millions):
Fair Value Measured Using Significant
Unobservable Inputs (Level 3)
Total
Corporate
bonds
Mortgage-
and other-
asset backed
securities
U.S.
government
securities
Balance, beginning of year $ 2.8 $ 2.7 $ — $ 0.1
Purchases, sales, settlements, net 0.4 (0.1) 0.5 —
Unrealized gains 0.8 0.8 — —
Balance, end of year $ 4.0 $ 3.4 $ 0.5 $ 0.1