Safeway 2012 Annual Report Download - page 54
Download and view the complete annual report
Please find page 54 of the 2012 Safeway annual report below. You can navigate through the pages in the report by either clicking on the pages listed below, or by using the keyword search tool below to find specific information within the annual report.-
 1
1 -
2
-
3
-
4
-
5
-
6
-
7
-
8
-
9
-
10
-
11
-
12
-
13
-
14
-
15
-
16
-
17
-
18
-
19
-
20
-
21
-
22
-
23
-
24
-
25
-
26
-
27
-
28
-
29
-
30
-
31
-
32
-
33
-
34
-
35
-
36
-
37
-
38
-
39
-
40
-
41
-
42
-
43
-
 44
44 -
 45
45 -
 46
46 -
 47
47 -
 48
48 -
 49
49 -
 50
50 -
 51
51 -
 52
52 -
 53
53 -
 54
54 -
 55
55 -
 56
56 -
 57
57 -
 58
58 -
 59
59 -
 60
60 -
 61
61 -
 62
62 -
 63
63 -
 64
64 -
65
-
66
-
67
-
68
-
69
-
70
-
71
-
72
-
73
-
74
-
75
-
76
-
77
-
78
-
79
-
80
-
81
-
82
-
83
-
84
-
85
-
86
-
87
-
88
-
89
-
90
-
91
-
92
-
93
-
94
-
95
-
96
-
97
-
98
-
99
-
100
-
101
-
102
-
103
-
104
-
105
-
106
 |
 |

42
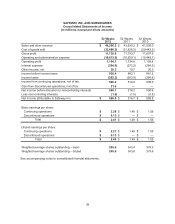
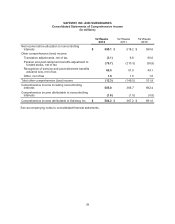
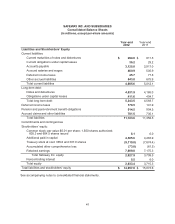
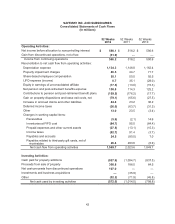
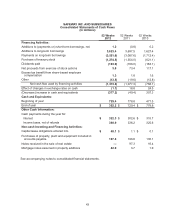
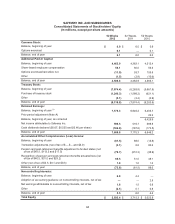
SAFEWAY INC. AND SUBSIDIARIES
Consolidated Statements of Cash Flows
(In millions)
52 Weeks
2012
52 Weeks
2011
52 Weeks
2010
Operating Activities:
Net income before allocation to noncontrolling interest $ 598.1 $ 518.2 $ 590.6
Gain from discontinued operations, net of tax (31.9) ——
Income from continuing operations 566.2 518.2 590.6
Reconciliation to net cash flow from operating activities:
Depreciation expense 1,134.3 1,148.8 1,162.4
Property impairment charges 46.5 44.7 71.7
Share-based employee compensation 55.1 50.0 55.5
LIFO expense (income) 0.7 35.1 (28.0)
Equity in earnings of unconsolidated affiliate (17.5) (13.0) (15.3)
Net pension and post-retirement benefits expense 150.8 114.3 125.2
Contributions to pension and post-retirement benefit plans (159.5) (176.2) (17.7)
Gain on property dispositions and lease exit costs, net (79.1) (65.6) (27.5)
Increase in accrued claims and other liabilities 44.8 23.2 36.2
Deferred income taxes (36.0) (63.7) (31.3)
Other 13.0 23.5 (3.4)
Changes in working capital items:
Receivables (5.6) (2.1) 14.6
Inventories at FIFO cost (84.7) 95.0 (64.4)
Prepaid expenses and other current assets (27.5) (13.1) (15.3)
Income taxes (82.7) 91.4 (3.7)
Payables and accruals 24.5 (80.5) 7.0
Payables related to third-party gift cards, net of
receivables 26.4 293.6 (6.9)
Net cash flow from operating activities 1,569.7 2,023.6 1,849.7
Investing Activities:
Cash paid for property additions (927.6) (1,094.7) (837.5)
Proceeds from sale of property 300.8 188.0 84.5
Net cash proceeds from discontinued operations 107.0 ——
Investments and business acquisitions —(35.9) —
Other (52.2) (71.9) (45.8)
Net cash used by investing activities (572.0) (1,014.5) (798.8)