Safeway 2012 Annual Report Download - page 79
Download and view the complete annual report
Please find page 79 of the 2012 Safeway annual report below. You can navigate through the pages in the report by either clicking on the pages listed below, or by using the keyword search tool below to find specific information within the annual report.-
 1
1 -
2
-
3
-
4
-
5
-
6
-
7
-
8
-
9
-
10
-
11
-
12
-
13
-
14
-
15
-
16
-
17
-
18
-
19
-
20
-
21
-
22
-
23
-
24
-
25
-
26
-
27
-
28
-
29
-
30
-
31
-
32
-
33
-
34
-
35
-
36
-
37
-
38
-
39
-
40
-
41
-
42
-
43
-
44
-
45
-
46
-
47
-
48
-
49
-
50
-
51
-
52
-
53
-
54
-
55
-
56
-
57
-
58
-
59
-
60
-
61
-
62
-
63
-
64
-
65
-
66
-
67
-
68
-
 69
69 -
 70
70 -
 71
71 -
 72
72 -
 73
73 -
 74
74 -
 75
75 -
 76
76 -
 77
77 -
 78
78 -
 79
79 -
 80
80 -
 81
81 -
 82
82 -
 83
83 -
 84
84 -
 85
85 -
 86
86 -
 87
87 -
 88
88 -
 89
89 -
90
-
91
-
92
-
93
-
94
-
95
-
96
-
97
-
98
-
99
-
100
-
101
-
102
-
103
-
104
-
105
-
106
 |
 |

SAFEWAY INC. AND SUBSIDIARIES
Notes to Consolidated Financial Statements
67
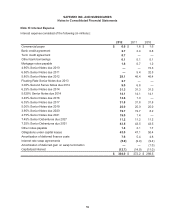
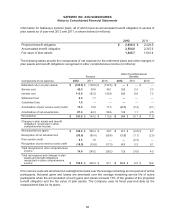
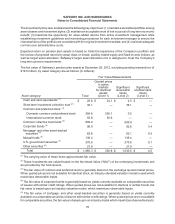
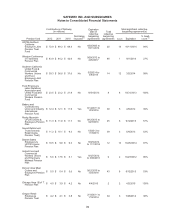
The following table provides a reconciliation of the changes in the retirement plans’ benefit obligation and
fair value of assets over the two-year period ended December 29, 2012 and a statement of the funded status
as of year-end 2012 and year-end 2011 (in millions):
Pension Other Post-Retirement Benefits
2012 2011 2012 2011
Change in projected benefit obligation:
Beginning balance $ 2,424.5 $ 2,257.2 $ 131.1 $ 132.8
Service cost 42.5 39.6 2.5 2.4
Interest cost 113.9 122.9 5.6 6.8
Plan amendments 0.4 1.0 —(2.3)
Actuarial loss (gain) 203.4 149.0 2.1 (0.5)
Plan participant contributions ——1.0 1.6
Benefit payments (158.8) (136.2) (8.4) (8.9)
Currency translation adjustment 9.5 (9.0) 1.1 (0.8)
Ending balance $ 2,635.4 $ 2,424.5 $ 135.0 $ 131.1
Change in fair value of plan assets:
Beginning balance $ 1,641.4 $ 1,652.2 $—$—
Actual return on plan assets 204.6 (37.9) ——
Employer contributions 152.1 169.0 7.4 7.3
Plan participant contributions ——1.0 1.6
Benefit payments (158.8) (136.2) (8.4) (8.9)
Currency translation adjustment 6.4 (5.7) ——
Ending balance $ 1,845.7 $ 1,641.4 $—$—
Components of net amount recognized in
financial position:
Other accrued liabilities (current liability) $(2.3)$(1.3)$(7.9)$(8.4)
Pension and postretirement benefit obligations
(non-current liability) (787.4) (781.8) (127.1) (122.7)
Funded status $ (789.7) $ (783.1) $ (135.0) $ (131.1)
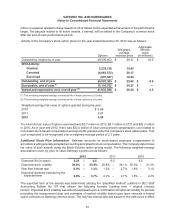
Amounts recognized in accumulated other comprehensive income consist of the following (in millions):
Pension
Other Post-Retirement
Benefits
2012 2011 2012 2011
Net actuarial loss $ 872.5 $843.5$ 25.4 $24.5
Prior service cost (credit) 17.3 32.3 (3.2) (3.5)
$ 889.8 $875.8$ 22.2 $21.0
Safeway expects approximately $95.0 million of the net actuarial pension loss and $11.3 million of the prior
service cost to be recognized as a component of net periodic benefit cost in 2013.