Safeway 2012 Annual Report Download - page 69
Download and view the complete annual report
Please find page 69 of the 2012 Safeway annual report below. You can navigate through the pages in the report by either clicking on the pages listed below, or by using the keyword search tool below to find specific information within the annual report.-
 1
1 -
2
-
3
-
4
-
5
-
6
-
7
-
8
-
9
-
10
-
11
-
12
-
13
-
14
-
15
-
16
-
17
-
18
-
19
-
20
-
21
-
22
-
23
-
24
-
25
-
26
-
27
-
28
-
29
-
30
-
31
-
32
-
33
-
34
-
35
-
36
-
37
-
38
-
39
-
40
-
41
-
42
-
43
-
44
-
45
-
46
-
47
-
48
-
49
-
50
-
51
-
52
-
53
-
54
-
55
-
56
-
57
-
58
-
 59
59 -
 60
60 -
 61
61 -
 62
62 -
 63
63 -
 64
64 -
 65
65 -
 66
66 -
 67
67 -
 68
68 -
 69
69 -
 70
70 -
 71
71 -
 72
72 -
 73
73 -
 74
74 -
 75
75 -
 76
76 -
 77
77 -
 78
78 -
 79
79 -
80
-
81
-
82
-
83
-
84
-
85
-
86
-
87
-
88
-
89
-
90
-
91
-
92
-
93
-
94
-
95
-
96
-
97
-
98
-
99
-
100
-
101
-
102
-
103
-
104
-
105
-
106
 |
 |

SAFEWAY INC. AND SUBSIDIARIES
Notes to Consolidated Financial Statements
57
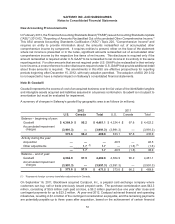
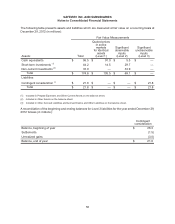
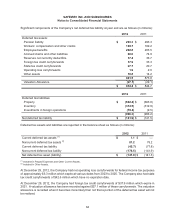
The following table presents assets and liabilities which are measured at fair value on a recurring basis at
December 31, 2011 (in millions):
Fair Value Measurements
Assets: Total
Quoted prices
in active
markets
for identical
assets
(Level 1)
Significant
observable
inputs
(Level 2)
Significant
unobservable
inputs
(Level 3)
Cash equivalents $ 546.0 $290.0 $256.0$ —
Short-term investments (1) 52.4 22.6 29.8 —
Non-current investments (2) 38.7 — 38.7 —
Interest rate swap (2) 4.4 — 4.4 —
Total $641.5 $312.6 $328.9$ —
Liabilities:
Contingent consideration (3) $26.3 $—$—$26.3
Total $26.3 $—$—$26.3
(1) Included in Prepaid Expense and Other Current Assets on the balance sheet.
(2) Included in Other Assets on the balance sheet.
(3) Included in Other Accrued Liabilities on the balance sheet.
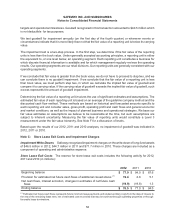
A reconciliation of the beginning and ending balances for Level 3 liabilities for the year ended December 31,
2011 follows (in millions):
Contingent
consideration
Balance, beginning of year $ 3.0
Additions 23.2
Unrealized losses 0.1
Balance, end of year $ 26.3
In determining the fair value of assets and liabilities, the Company maximizes the use of quoted market
prices and minimizes the use of unobservable inputs. The Level 1 fair values are based on quoted market
values for identical assets. The fair values of Level 2 assets and liabilities are determined using prices from
pricing agencies and financial institutions that develop values based on observable inputs in active markets.
Level 3 fair values are determined from industry valuation models based on externally developed inputs.
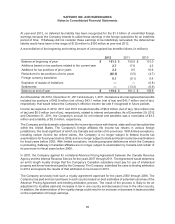
In connection with the Company’s evaluation of long-lived assets for impairment, certain long-lived assets
were measured at fair value on a nonrecurring basis using Level 3 inputs as defined in the fair value hierarchy.
Fair value of long-lived assets is determined by estimating the amount and timing of net future cash flows
(including rental expense for leased properties, sublease rental income, common area maintenance costs
and real estate taxes) and discounting them using a risk-adjusted rate of interest. Safeway estimates future
cash flows based on its experience and knowledge of the market in which the store is located and, when
necessary, uses real estate brokers. During fiscal 2012, long-lived assets with a carrying value of $74.6
million were written down to their estimated fair value of $28.1 million, resulting in an impairment charge of
$46.5 million. During fiscal 2011, long-lived assets with a carrying value of $64.1 million were written down
to their estimated fair value of $19.4 million, resulting in an impairment charge of $44.7 million.