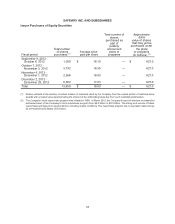
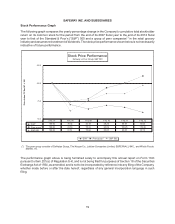
Safeway 2012 Annual Report Download - page 40
Download and view the complete annual report
Please find page 40 of the 2012 Safeway annual report below. You can navigate through the pages in the report by either clicking on the pages listed below, or by using the keyword search tool below to find specific information within the annual report.-
 1
1 -
2
-
3
-
4
-
5
-
6
-
7
-
8
-
9
-
10
-
11
-
12
-
13
-
14
-
15
-
16
-
17
-
18
-
19
-
20
-
21
-
22
-
23
-
24
-
25
-
26
-
27
-
28
-
29
-
 30
30 -
 31
31 -
 32
32 -
 33
33 -
 34
34 -
 35
35 -
 36
36 -
 37
37 -
 38
38 -
 39
39 -
 40
40 -
 41
41 -
 42
42 -
 43
43 -
 44
44 -
 45
45 -
 46
46 -
 47
47 -
 48
48 -
 49
49 -
 50
50 -
51
-
52
-
53
-
54
-
55
-
56
-
57
-
58
-
59
-
60
-
61
-
62
-
63
-
64
-
65
-
66
-
67
-
68
-
69
-
70
-
71
-
72
-
73
-
74
-
75
-
76
-
77
-
78
-
79
-
80
-
81
-
82
-
83
-
84
-
85
-
86
-
87
-
88
-
89
-
90
-
91
-
92
-
93
-
94
-
95
-
96
-
97
-
98
-
99
-
100
-
101
-
102
-
103
-
104
-
105
-
106
 |
 |

SAFEWAY INC. AND SUBSIDIARIES
28
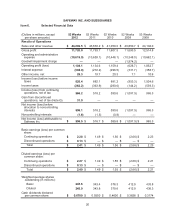
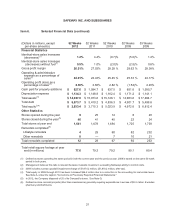
Cash paid for property additions was $0.9 billion in 2012, $1.1 billion in 2011 and $0.8 billion in 2010. The
decrease in capital expenditures in 2012 was due to fewer store openings and fewer remodels. The increase
in capital expenditures in 2011 compared to 2010 was primarily due to an increase in new store openings
and the refurbishment of some in-store pharmacies. In 2012, the Company opened nine new Lifestyle stores
and completed four Lifestyle store remodels. In 2011, the Company opened 25 new Lifestyle stores and
completed 29 Lifestyle store remodels. In 2010, the Company opened 14 new Lifestyle stores and completed
60 Lifestyle store remodels. In 2013, the Company expects to spend approximately $1.1 billion in cash capital
expenditures.
Net cash flow used by financing activities was $1,373.8 million in 2012, $1,077.3 million in 2011 and $768.1
million in 2010. In 2012, net cash additions to debt were $73.0 million. The Company also repurchased
$1,274.5 million of common stock and paid $163.9 million in dividends. In 2011, Safeway had net cash
additions to debt of $609.1 million, repurchased $1,554.0 million of common stock and paid $188.0 million
in dividends. In 2010, net cash payments on debt were $84.8 million. Additionally, the Company repurchased
$621.1 million of common stock and paid $168.1 million in dividends.
As previously announced, Safeway’s subsidiary, Blackhawk Network Holdings, Inc., plans to file a registration
statement in the United States for a potential initial public offering of a minority stake in Blackhawk Network
Holdings. Depending on market conditions, the Company anticipates executing a transaction in the first half
of 2013. This Annual Report on Form 10-K does not constitute an offer to sell, or a solicitation of an offer to
buy, any securities, which will be made only by prospectus.
Based upon the current level of operations, Safeway believes that net cash flow from operating activities
and other sources of liquidity, including potential borrowing under Safeway’s commercial paper program, its
credit agreement and debt offerings, will be adequate to meet anticipated requirements for working capital,
capital expenditures, interest payments, dividend payments, stock repurchases, if any, and scheduled
principal payments for the foreseeable future. There can be no assurance, however, that Safeway’s business
will continue to generate cash flow at or above current levels or that the Company will maintain its ability to
borrow under its commercial paper program and credit agreement.
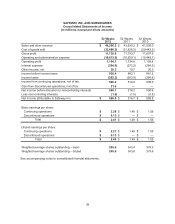
Free cash flow Free cash flow is calculated as (1) net cash flow from operating activities adjusted to
exclude payables related to third-party gift cards, net of receivables, less (2) net cash flow used by investing
activities adjusted to exclude cash used by investments and business acquisitions. Cash from the sale of
third-party gift cards is held for a short period of time and then remitted, less our commission, to card partners.
Because this cash flow is temporary, it is not available for other uses, and it is therefore excluded from our
calculation of free cash flow. We add back cash used by investments and business acquisitions to our
calculation of free cash flow in order to provide a more accurate indication of our capacity to apply our
available free cash flow to its intended uses.
Fiscal Year
(in millions) 2012 2011 2010
Net cash flow from operating activities $ 1,569.7 $ 2,023.6 $ 1,849.7
(Increase) decrease in payables related to third-party gift
cards, net of receivables (26.4) (293.6) 6.9
Net cash flow from operating activities, as adjusted 1,543.3 1,730.0 1,856.6
Net cash flow used by investing activities (572.0) (1,014.5) (798.8)
Investments and business acquisitions —35.9 —
Net cash flow used by investing activities, as adjusted (572.0) (978.6) (798.8)
Free cash flow $ 971.3 $ 751.4 $ 1,057.8