Safeway 2012 Annual Report Download - page 92
Download and view the complete annual report
Please find page 92 of the 2012 Safeway annual report below. You can navigate through the pages in the report by either clicking on the pages listed below, or by using the keyword search tool below to find specific information within the annual report.-
 1
1 -
2
-
3
-
4
-
5
-
6
-
7
-
8
-
9
-
10
-
11
-
12
-
13
-
14
-
15
-
16
-
17
-
18
-
19
-
20
-
21
-
22
-
23
-
24
-
25
-
26
-
27
-
28
-
29
-
30
-
31
-
32
-
33
-
34
-
35
-
36
-
37
-
38
-
39
-
40
-
41
-
42
-
43
-
44
-
45
-
46
-
47
-
48
-
49
-
50
-
51
-
52
-
53
-
54
-
55
-
56
-
57
-
58
-
59
-
60
-
61
-
62
-
63
-
64
-
65
-
66
-
67
-
68
-
69
-
70
-
71
-
72
-
73
-
74
-
75
-
76
-
77
-
78
-
79
-
80
-
81
-
 82
82 -
 83
83 -
 84
84 -
 85
85 -
 86
86 -
 87
87 -
 88
88 -
 89
89 -
 90
90 -
 91
91 -
 92
92 -
 93
93 -
 94
94 -
 95
95 -
 96
96 -
 97
97 -
 98
98 -
 99
99 -
 100
100 -
 101
101 -
 102
102 -
103
-
104
-
105
-
106
 |
 |

SAFEWAY INC. AND SUBSIDIARIES
Notes to Consolidated Financial Statements
80
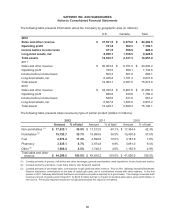
The following table presents information about the Company by geographic area (in millions):
U.S. Canada Total
2012
Sales and other revenue $ 37,531.5 $ 6,675.0 $ 44,206.5
Operating profit 741.8 362.3 1,104.1
Income before income taxes 471.5 356.9 828.4
Long-lived assets, net 8,058.1 1,166.5 9,224.6
Total assets 12,535.7 2,121.3 14,657.0
2011
Sales and other revenue $ 36,923.2 $ 6,707.0 $ 43,630.2
Operating profit 745.5 389.1 1,134.6
Income before income taxes 500.3 381.8 882.1
Long-lived assets, net 8,456.2 1,181.4 9,637.6
Total assets 12,982.1 2,091.5 15,073.6
2010
Sales and other revenue $ 34,782.4 $ 6,267.6 $ 41,050.0
Operating profit 828.8 330.6 1,159.4
Income before income taxes 549.6 331.6 881.2
Long-lived assets, net 8,607.2 1,303.0 9,910.2
Total assets 12,448.7 2,699.4 15,148.1
The following table presents sales revenue by type of similar product (dollars in millions):
2012 2011 2010
Amount % of total Amount % of total Amount % of total
Non-perishables (1) $17,635.1 39.9% $ 17,512.9 40.1% $ 17,364.4 42.3%
Perishables (2) 15,792.7 35.7% 15,899.6 36.5% 15,430.8 37.6%
Fuel 4,974.2 11.2% 4,596.6 10.5% 3,187.9 7.8%
Pharmacy 3,835.1 8.7% 3,874.8 8.9% 3,881.0 9.4%
Other (3) 1,969.4 4.5% 1,746.3 4.0% 1,185.9 2.9%
Total sales and other
revenue $44,206.5 100.0% $ 43,630.2 100.0% $ 41,050.0 100.0%
(1) Consists primarily of grocery, soft drinks and other beverages, general merchandise, meal ingredients, frozen foods and snacks.
(2) Consists primarily of produce, meat, dairy, bakery, deli, floral and seafood.
(3) Consists primarily of wholesale sales, commissions on gift cards and other revenue. Prior to 2011, Safeway recorded Blackhawk
Network distribution commissions on the sale of certain gift cards, net of commissions shared with other retailers. In the first
quarter of 2011, Safeway determined that these commissions should be reported on a gross basis. This change increased both
revenue and cost of goods sold in fiscal 2011 by $413.5 million but had no impact on identical-store sales, gross profit dollars or
net income. Previously reported results are not adjusted because the impact is immaterial.