Safeway 2012 Annual Report Download - page 51
Download and view the complete annual report
Please find page 51 of the 2012 Safeway annual report below. You can navigate through the pages in the report by either clicking on the pages listed below, or by using the keyword search tool below to find specific information within the annual report.-
 1
1 -
2
-
3
-
4
-
5
-
6
-
7
-
8
-
9
-
10
-
11
-
12
-
13
-
14
-
15
-
16
-
17
-
18
-
19
-
20
-
21
-
22
-
23
-
24
-
25
-
26
-
27
-
28
-
29
-
30
-
31
-
32
-
33
-
34
-
35
-
36
-
37
-
38
-
39
-
40
-
 41
41 -
 42
42 -
 43
43 -
 44
44 -
 45
45 -
 46
46 -
 47
47 -
 48
48 -
 49
49 -
 50
50 -
 51
51 -
 52
52 -
 53
53 -
 54
54 -
 55
55 -
 56
56 -
 57
57 -
 58
58 -
 59
59 -
 60
60 -
 61
61 -
62
-
63
-
64
-
65
-
66
-
67
-
68
-
69
-
70
-
71
-
72
-
73
-
74
-
75
-
76
-
77
-
78
-
79
-
80
-
81
-
82
-
83
-
84
-
85
-
86
-
87
-
88
-
89
-
90
-
91
-
92
-
93
-
94
-
95
-
96
-
97
-
98
-
99
-
100
-
101
-
102
-
103
-
104
-
105
-
106
 |
 |

39
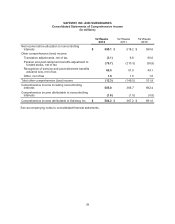
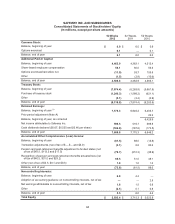
SAFEWAY INC. AND SUBSIDIARIES
Consolidated Statements of Comprehensive Income
(In millions)
52 Weeks
2012
52 Weeks
2011
52 Weeks
2010
Net income before allocation to noncontrolling
interests $598.1 $ 518.2 $ 590.6
Other comprehensive (loss) income:
Translation adjustments, net of tax (3.1) 8.8 90.6
Pension and post-retirement benefits adjustment to
funded status, net of tax (79.7)(210.3) (38.9)
Recognition of pension and post-retirement benefits
actuarial loss, net of tax 69.5 51.0 49.1
Other, net of tax 1.0 1.0 1.0
Total other comprehensive (loss) income (12.3)(149.5) 101.8
Comprehensive income including noncontrolling
interests 585.8 368.7 692.4
Comprehensive income attributable to noncontrolling
interests (1.6) (1.5) (0.8)
Comprehensive income attributable to Safeway Inc. $584.2 $ 367.2 $ 691.6
See accompanying notes to consolidated financial statements.