Sprint - Nextel 2015 Annual Report Download - page 106
Download and view the complete annual report
Please find page 106 of the 2015 Sprint - Nextel annual report below. You can navigate through the pages in the report by either clicking on the pages listed below, or by using the keyword search tool below to find specific information within the annual report.-
 1
1 -
2
-
3
-
4
-
5
-
6
-
7
-
8
-
9
-
10
-
11
-
12
-
13
-
14
-
15
-
16
-
17
-
18
-
19
-
20
-
21
-
22
-
23
-
24
-
25
-
26
-
27
-
28
-
29
-
30
-
31
-
32
-
33
-
34
-
35
-
36
-
37
-
38
-
39
-
40
-
41
-
42
-
43
-
44
-
45
-
46
-
47
-
48
-
49
-
50
-
51
-
52
-
53
-
54
-
55
-
56
-
57
-
58
-
59
-
60
-
61
-
62
-
63
-
64
-
65
-
66
-
67
-
68
-
69
-
70
-
71
-
72
-
73
-
74
-
75
-
76
-
77
-
78
-
79
-
80
-
81
-
82
-
83
-
84
-
85
-
86
-
87
-
88
-
89
-
90
-
91
-
92
-
93
-
94
-
95
-
 96
96 -
 97
97 -
 98
98 -
 99
99 -
 100
100 -
 101
101 -
 102
102 -
 103
103 -
 104
104 -
 105
105 -
 106
106 -
 107
107 -
 108
108 -
 109
109 -
 110
110 -
 111
111 -
 112
112 -
 113
113 -
 114
114 -
 115
115 -
 116
116 -
117
-
118
-
119
-
120
-
121
-
122
-
123
-
124
-
125
-
126
-
127
-
128
-
129
-
130
-
131
-
132
-
133
-
134
-
135
-
136
-
137
-
138
-
139
-
140
-
141
-
142
-
143
-
144
-
145
-
146
-
147
-
148
-
149
-
150
-
151
-
152
-
153
-
154
-
155
-
156
-
157
-
158
-
159
-
160
-
161
-
162
-
163
-
164
-
165
-
166
-
167
-
168
-
169
-
170
-
171
-
172
-
173
-
174
-
175
-
176
-
177
-
178
-
179
-
180
-
181
-
182
-
183
-
184
-
185
-
186
-
187
-
188
-
189
-
190
-
191
-
192
-
193
-
194
-
195
-
196
-
197
-
198
-
199
-
200
-
201
-
202
-
203
-
204
-
205
-
206
-
207
-
208
-
209
-
210
-
211
-
212
-
213
-
214
-
215
-
216
-
217
-
218
-
219
-
220
-
221
-
222
-
223
-
224
-
225
-
226
-
227
-
228
-
229
-
230
-
231
-
232
-
233
-
234
-
235
-
236
-
237
-
238
-
239
-
240
-
241
-
242
-
243
-
244
-
245
-
246
-
247
-
248
-
249
-
250
-
251
-
252
-
253
-
254
-
255
-
256
-
257
-
258
-
259
-
260
-
261
-
262
-
263
-
264
-
265
-
266
-
267
-
268
-
269
-
270
-
271
-
272
-
273
-
274
-
275
-
276
-
277
-
278
-
279
-
280
-
281
-
282
-
283
-
284
-
285
-
286
-
287
-
288
-
289
-
290
-
291
-
292
-
293
-
294
-
295
-
296
-
297
-
298
-
299
-
300
-
301
-
302
-
303
-
304
-
305
-
306
-
307
-
308
-
309
-
310
-
311
-
312
-
313
-
314
-
315
-
316
-
317
-
318
-
319
-
320
-
321
-
322
-
323
-
324
-
325
-
326
-
327
-
328
-
329
-
330
-
331
-
332
-
333
-
334
-
335
-
336
-
337
-
338
-
339
-
340
-
341
-
342
-
343
-
344
-
345
-
346
-
347
-
348
-
349
-
350
-
351
-
352
-
353
-
354
-
355
-
356
-
357
-
358
-
359
-
360
-
361
-
362
-
363
-
364
-
365
-
366
-
367
-
368
-
369
-
370
-
371
-
372
-
373
-
374
-
375
-
376
-
377
-
378
-
379
-
380
-
381
-
382
-
383
-
384
-
385
-
386
-
387
-
388
-
389
-
390
-
391
-
392
-
393
-
394
-
395
-
396
-
397
-
398
-
399
-
400
-
401
-
402
-
403
-
404
-
405
-
406
 |
 |
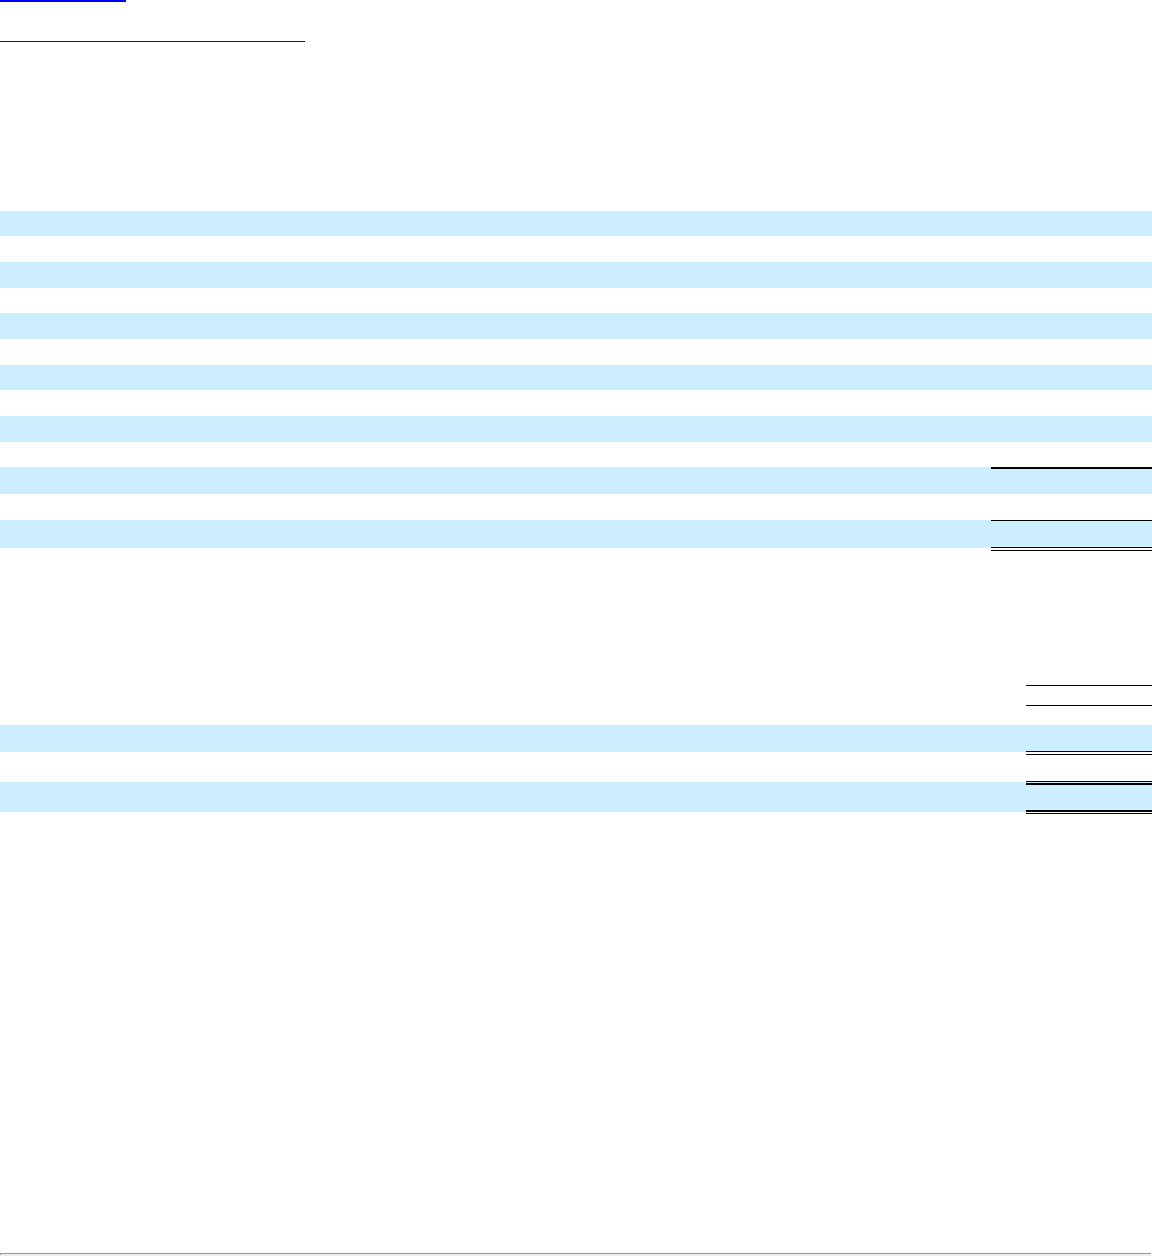
Table of Contents
Index to Consolidated Financial Statements
SPRINT CORPORATION
NOTES TO THE CONSOLIDATED FINANCIAL STATEMENTS
The following table summarizes the purchase price allocation of consideration transferred:
Purchase Price Allocation (in millions) :
Current assets $ 8,576
Investments 133
Property, plant and equipment 14,558
Identifiable intangibles 50,672
Goodwill 6,343
Other assets 244
Current liabilities (10,623)
Long-term debt (29,481)
Deferred tax liabilities (14,256)
Other liabilities (3,989)
Net assets acquired, prior to conversion of the Bond 22,177
Conversion of Bond 3,100
Net assets acquired, after conversion of the Bond $ 25,277
Pro Forma Financial Information
The following unaudited pro forma consolidated results of operations assume that the SoftBank Merger and Clearwire Acquisition were completed as
of January 1, 2013.
Years Ended
December 31,
2013
(in millions)
Net operating revenues $ 35,953
Net loss $ (4,290)
Basic loss per common share $ (1.12)
The unaudited pro forma financial information was prepared to illustrate the pro forma effect of the combination of Sprint, Sprint Communications and
Clearwire using the consideration transferred as of each acquisition date as though the acquisition date for each transaction occurred on January 1, 2013. The
preparation of the pro forma financial information also assumed a purchase price allocation of the consideration transferred among the assets acquired and
liabilities assumed for each acquiree. The pro forma financial information adjusts the actual combined results for items that are recurring in nature and directly
attributable to the Clearwire Acquisition and SoftBank Merger. The pro forma net loss provided excludes certain non-recurring items such as Sprint's gain on its
previously held interest in Clearwire and transaction costs associated with the Clearwire Acquisition and SoftBank Merger. As a result, the pro forma financial
information presented above excludes a net gain of $1.4 billion and acquisition related costs of approximately $169 million .
This pro forma financial information has been prepared based on estimates and assumptions, which management believes are reasonable, and is not
necessarily indicative of the consolidated financial position or results of operations that Sprint would have achieved had the Clearwire Acquisition and/or the
SoftBank Merger actually occurred at January 1, 2013 or at any other historical date, nor is it reflective of our expected actual financial positions or results of
operations for any future period.
Note 4. Funding Sources
Our device leasing and installment billing programs require a greater use of operating cash flows in the earlier part of the device contracts as our
subscribers will generally pay less upfront than traditional subsidized programs. The Accounts Receivable Facility and the Handset Sale-Leaseback Tranche 1
transactions described below were designed to mitigate the significant use of cash from purchasing devices from OEMs to fulfill our installment billing and leasing
programs. In addition, we have $3.0 billion of availability under our revolving credit facility ( seeNote9.Long-TermDebt,FinancingandCapitalLease
Obligations). After March 31, 2016 we also entered into a Network Sale-Leaseback transaction and Handset
F-22