Sprint - Nextel 2015 Annual Report Download - page 50
Download and view the complete annual report
Please find page 50 of the 2015 Sprint - Nextel annual report below. You can navigate through the pages in the report by either clicking on the pages listed below, or by using the keyword search tool below to find specific information within the annual report.-
 1
1 -
2
-
3
-
4
-
5
-
6
-
7
-
8
-
9
-
10
-
11
-
12
-
13
-
14
-
15
-
16
-
17
-
18
-
19
-
20
-
21
-
22
-
23
-
24
-
25
-
26
-
27
-
28
-
29
-
30
-
31
-
32
-
33
-
34
-
35
-
36
-
37
-
38
-
39
-
 40
40 -
 41
41 -
 42
42 -
 43
43 -
 44
44 -
 45
45 -
 46
46 -
 47
47 -
 48
48 -
 49
49 -
 50
50 -
 51
51 -
 52
52 -
 53
53 -
 54
54 -
 55
55 -
 56
56 -
 57
57 -
 58
58 -
 59
59 -
 60
60 -
61
-
62
-
63
-
64
-
65
-
66
-
67
-
68
-
69
-
70
-
71
-
72
-
73
-
74
-
75
-
76
-
77
-
78
-
79
-
80
-
81
-
82
-
83
-
84
-
85
-
86
-
87
-
88
-
89
-
90
-
91
-
92
-
93
-
94
-
95
-
96
-
97
-
98
-
99
-
100
-
101
-
102
-
103
-
104
-
105
-
106
-
107
-
108
-
109
-
110
-
111
-
112
-
113
-
114
-
115
-
116
-
117
-
118
-
119
-
120
-
121
-
122
-
123
-
124
-
125
-
126
-
127
-
128
-
129
-
130
-
131
-
132
-
133
-
134
-
135
-
136
-
137
-
138
-
139
-
140
-
141
-
142
-
143
-
144
-
145
-
146
-
147
-
148
-
149
-
150
-
151
-
152
-
153
-
154
-
155
-
156
-
157
-
158
-
159
-
160
-
161
-
162
-
163
-
164
-
165
-
166
-
167
-
168
-
169
-
170
-
171
-
172
-
173
-
174
-
175
-
176
-
177
-
178
-
179
-
180
-
181
-
182
-
183
-
184
-
185
-
186
-
187
-
188
-
189
-
190
-
191
-
192
-
193
-
194
-
195
-
196
-
197
-
198
-
199
-
200
-
201
-
202
-
203
-
204
-
205
-
206
-
207
-
208
-
209
-
210
-
211
-
212
-
213
-
214
-
215
-
216
-
217
-
218
-
219
-
220
-
221
-
222
-
223
-
224
-
225
-
226
-
227
-
228
-
229
-
230
-
231
-
232
-
233
-
234
-
235
-
236
-
237
-
238
-
239
-
240
-
241
-
242
-
243
-
244
-
245
-
246
-
247
-
248
-
249
-
250
-
251
-
252
-
253
-
254
-
255
-
256
-
257
-
258
-
259
-
260
-
261
-
262
-
263
-
264
-
265
-
266
-
267
-
268
-
269
-
270
-
271
-
272
-
273
-
274
-
275
-
276
-
277
-
278
-
279
-
280
-
281
-
282
-
283
-
284
-
285
-
286
-
287
-
288
-
289
-
290
-
291
-
292
-
293
-
294
-
295
-
296
-
297
-
298
-
299
-
300
-
301
-
302
-
303
-
304
-
305
-
306
-
307
-
308
-
309
-
310
-
311
-
312
-
313
-
314
-
315
-
316
-
317
-
318
-
319
-
320
-
321
-
322
-
323
-
324
-
325
-
326
-
327
-
328
-
329
-
330
-
331
-
332
-
333
-
334
-
335
-
336
-
337
-
338
-
339
-
340
-
341
-
342
-
343
-
344
-
345
-
346
-
347
-
348
-
349
-
350
-
351
-
352
-
353
-
354
-
355
-
356
-
357
-
358
-
359
-
360
-
361
-
362
-
363
-
364
-
365
-
366
-
367
-
368
-
369
-
370
-
371
-
372
-
373
-
374
-
375
-
376
-
377
-
378
-
379
-
380
-
381
-
382
-
383
-
384
-
385
-
386
-
387
-
388
-
389
-
390
-
391
-
392
-
393
-
394
-
395
-
396
-
397
-
398
-
399
-
400
-
401
-
402
-
403
-
404
-
405
-
406
 |
 |

Table of Contents
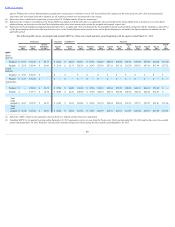
OtherRevenues
Other revenues, which primarily consist of sales of customer premises equipment, decreased $2 million , or 15% , in the Successor three-month
transition period ended March 31, 2014 compared to the same Predecessor period in 2013 .
Costs of Services
Costs of services include access costs paid to local phone companies, other domestic service providers and foreign phone companies to complete calls
made by our domestic subscribers, costs to operate and maintain our networks, and costs of equipment.
SuccessorYearEndedMarch31,2016andSuccessorYearEndedMarch31,2015
Costs of services decreased $376 million , or 16% , for the Successor year ended March 31, 2016 compared to the Successor year ended March 31,
2015 primarily due to lower international voice volume and rates combined with lower access expense as the result of savings initiatives and declining voice and IP
rate and volumes. Service gross margin percentage increased from 17% in the Successor year ended March 31, 2015 to 18% in the Successor year ended March 31,
2016 .
SuccessorYearEndedMarch31,2015andSuccessorYearEndedDecember31,2013
Costs of services increased $1.1 billion , or 89% , for the Successor year ended March 31, 2015 compared to the Successor year ended December 31,
2013 primarily due to comparing results for a full twelve-month period to a shortened Post-merger period. Offsetting the increase was a decrease primarily due to
lower access expense as a result of savings initiatives and declining volumes, which resulted in an overall decrease in cost of services when comparing the
Successor year ended March 31, 2015 to the Combined year ended December 31, 2013. Service gross margin percentage decreased from 25% in the Successor
year ended December 31, 2013 to 17% in the Successor year ended March 31, 2015 primarily as a result of a decrease in net service revenue partially offset by a
decrease in cost of services.
SuccessorThree-MonthTransitionPeriodEndedMarch31,2014andPredecessorThree-MonthPeriodEndedMarch31,2013
Costs of services increased $7 million , or 1% , in the Successor three-month transition period ended March 31, 2014 compared to the same Predecessor
period in 2013 primarily due to higher contractual rates impacting facility costs. Service gross margin percentage decreased from 26% in the Predecessor three-
month period ended March 31, 2013 to 13% in the Successor three-month transition period ended March 31, 2014 primarily as a result of a decrease in net service
revenue combined with a slight increase in cost of services.
Selling, General and Administrative Expense
SuccessorYearEndedMarch31,2016andSuccessorYearEndedMarch31,2015
Selling, general and administrative expense decreased $35 million , or 10% , in the Successor year ended March 31, 2016 compared to the Successor
year ended March 31, 2015 primarily due to a decrease in shared administrative and employee-related costs required to support the Wireline segment as a result of
the decline in revenue. Total selling, general and administrative expense as a percentage of net services revenue was 14% in the Successor year ended March 31,
2016 compared to 13% in the Successor year ended March 31, 2015 .
SuccessorYearEndedMarch31,2015andSuccessorYearEndedDecember31,2013
Selling, general and administrative expense increased $184 million , or 103% , in the Successor year ended March 31, 2015 compared to the Successor
year ended December 31, 2013 primarily due to comparing results for a full twelve-month period to a shortened Post-merger period, partially offset by a decrease
due to a reduction in shared administrative and employee-related costs required to support the Wireline segment as a result of the decline in revenue, which
resulted in an overall decrease in selling, general and administrative expense when comparing the Successor year ended March 31, 2015 to the Combined year
ended December 31, 2013. Total selling, general and administrative expense as a percentage of net services revenue was 13% in the Successor year ended
March 31, 2015 compared to 11% in the Successor year ended December 31, 2013 .
SuccessorThree-MonthTransitionPeriodEndedMarch31,2014andPredecessorThree-MonthPeriodEndedMarch31,2013
Selling, general and administrative expense decreased $14 million , or 13% , in the Successor three-month transition period ended March 31, 2014
compared to the same Predecessor period in 2013 . The decrease was primarily due to a reduction in shared administrative and employee related costs required to
support the Wireline segment as a result of the
48