Sprint - Nextel 2015 Annual Report Download - page 150
Download and view the complete annual report
Please find page 150 of the 2015 Sprint - Nextel annual report below. You can navigate through the pages in the report by either clicking on the pages listed below, or by using the keyword search tool below to find specific information within the annual report.-
 1
1 -
2
-
3
-
4
-
5
-
6
-
7
-
8
-
9
-
10
-
11
-
12
-
13
-
14
-
15
-
16
-
17
-
18
-
19
-
20
-
21
-
22
-
23
-
24
-
25
-
26
-
27
-
28
-
29
-
30
-
31
-
32
-
33
-
34
-
35
-
36
-
37
-
38
-
39
-
40
-
41
-
42
-
43
-
44
-
45
-
46
-
47
-
48
-
49
-
50
-
51
-
52
-
53
-
54
-
55
-
56
-
57
-
58
-
59
-
60
-
61
-
62
-
63
-
64
-
65
-
66
-
67
-
68
-
69
-
70
-
71
-
72
-
73
-
74
-
75
-
76
-
77
-
78
-
79
-
80
-
81
-
82
-
83
-
84
-
85
-
86
-
87
-
88
-
89
-
90
-
91
-
92
-
93
-
94
-
95
-
96
-
97
-
98
-
99
-
100
-
101
-
102
-
103
-
104
-
105
-
106
-
107
-
108
-
109
-
110
-
111
-
112
-
113
-
114
-
115
-
116
-
117
-
118
-
119
-
120
-
121
-
122
-
123
-
124
-
125
-
126
-
127
-
128
-
129
-
130
-
131
-
132
-
133
-
134
-
135
-
136
-
137
-
138
-
139
-
 140
140 -
 141
141 -
 142
142 -
 143
143 -
 144
144 -
 145
145 -
 146
146 -
 147
147 -
 148
148 -
 149
149 -
 150
150 -
 151
151 -
 152
152 -
 153
153 -
 154
154 -
 155
155 -
 156
156 -
 157
157 -
 158
158 -
 159
159 -
 160
160 -
161
-
162
-
163
-
164
-
165
-
166
-
167
-
168
-
169
-
170
-
171
-
172
-
173
-
174
-
175
-
176
-
177
-
178
-
179
-
180
-
181
-
182
-
183
-
184
-
185
-
186
-
187
-
188
-
189
-
190
-
191
-
192
-
193
-
194
-
195
-
196
-
197
-
198
-
199
-
200
-
201
-
202
-
203
-
204
-
205
-
206
-
207
-
208
-
209
-
210
-
211
-
212
-
213
-
214
-
215
-
216
-
217
-
218
-
219
-
220
-
221
-
222
-
223
-
224
-
225
-
226
-
227
-
228
-
229
-
230
-
231
-
232
-
233
-
234
-
235
-
236
-
237
-
238
-
239
-
240
-
241
-
242
-
243
-
244
-
245
-
246
-
247
-
248
-
249
-
250
-
251
-
252
-
253
-
254
-
255
-
256
-
257
-
258
-
259
-
260
-
261
-
262
-
263
-
264
-
265
-
266
-
267
-
268
-
269
-
270
-
271
-
272
-
273
-
274
-
275
-
276
-
277
-
278
-
279
-
280
-
281
-
282
-
283
-
284
-
285
-
286
-
287
-
288
-
289
-
290
-
291
-
292
-
293
-
294
-
295
-
296
-
297
-
298
-
299
-
300
-
301
-
302
-
303
-
304
-
305
-
306
-
307
-
308
-
309
-
310
-
311
-
312
-
313
-
314
-
315
-
316
-
317
-
318
-
319
-
320
-
321
-
322
-
323
-
324
-
325
-
326
-
327
-
328
-
329
-
330
-
331
-
332
-
333
-
334
-
335
-
336
-
337
-
338
-
339
-
340
-
341
-
342
-
343
-
344
-
345
-
346
-
347
-
348
-
349
-
350
-
351
-
352
-
353
-
354
-
355
-
356
-
357
-
358
-
359
-
360
-
361
-
362
-
363
-
364
-
365
-
366
-
367
-
368
-
369
-
370
-
371
-
372
-
373
-
374
-
375
-
376
-
377
-
378
-
379
-
380
-
381
-
382
-
383
-
384
-
385
-
386
-
387
-
388
-
389
-
390
-
391
-
392
-
393
-
394
-
395
-
396
-
397
-
398
-
399
-
400
-
401
-
402
-
403
-
404
-
405
-
406
 |
 |

Table of Contents
Index to Consolidated Financial Statements
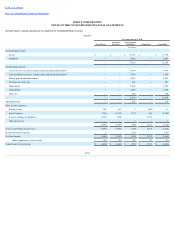
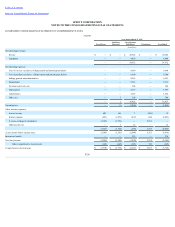
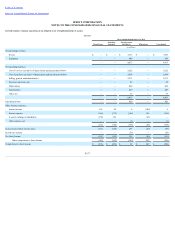
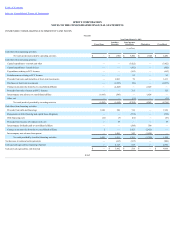
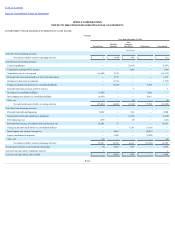
SPRINT CORPORATION
NOTES TO THE CONSOLIDATED FINANCIAL STATEMENTS
CONDENSED CONSOLIDATING STATEMENT OF CASH FLOWS
Predecessor
191 Days Ended July 10, 2013
Subsidiary Guarantor
Non-
Guarantor Subsidiaries
Eliminations
Consolidated
(inmillions)
Cash flows from operating activities:
Net cash (used in) provided by operating activities $ (559)
$ 3,230
$ —
$ 2,671
Cash flows from investing activities:
Capital expenditures —
(3,140)
—
(3,140)
Expenditures relating to FCC licenses —
(125)
—
(125)
Acquisitions, net of cash acquired (4,039)
—
—
(4,039)
Investment in Clearwire (including debt securities) —
(308)
—
(308)
Proceeds from sales and maturities of short-term investments 2,445
—
—
2,445
Purchases of short-term investments (1,221)
—
—
(1,221)
Change in amounts due from/due to consolidated affiliates (372)
—
372
—
Proceeds from sales of assets and FCC licenses —
10
—
10
Other, net —
(7)
—
(7)
Net cash (used in) provided by investing activities (3,187)
(3,570)
372
(6,385)
Cash flows from financing activities:
Proceeds from debt and financings —
204
—
204
Repayments of debt and capital lease obligations —
(362)
—
(362)
Debt financing costs (11)
—
—
(11)
Proceeds from issuance of common stock, net 60
—
—
60
Change in amounts due from/due to consolidated affiliates —
372
(372)
—
Net cash provided by (used in) financing activities 49
214
(372)
(109)
Net decrease in cash and cash equivalents (3,697)
(126)
—
(3,823)
Cash and cash equivalents, beginning of period 5,218
1,133
—
6,351
Cash and cash equivalents, end of period $ 1,521
$ 1,007
$ —
$ 2,528
F-65