Sprint - Nextel 2015 Annual Report Download - page 134
Download and view the complete annual report
Please find page 134 of the 2015 Sprint - Nextel annual report below. You can navigate through the pages in the report by either clicking on the pages listed below, or by using the keyword search tool below to find specific information within the annual report.-
 1
1 -
2
-
3
-
4
-
5
-
6
-
7
-
8
-
9
-
10
-
11
-
12
-
13
-
14
-
15
-
16
-
17
-
18
-
19
-
20
-
21
-
22
-
23
-
24
-
25
-
26
-
27
-
28
-
29
-
30
-
31
-
32
-
33
-
34
-
35
-
36
-
37
-
38
-
39
-
40
-
41
-
42
-
43
-
44
-
45
-
46
-
47
-
48
-
49
-
50
-
51
-
52
-
53
-
54
-
55
-
56
-
57
-
58
-
59
-
60
-
61
-
62
-
63
-
64
-
65
-
66
-
67
-
68
-
69
-
70
-
71
-
72
-
73
-
74
-
75
-
76
-
77
-
78
-
79
-
80
-
81
-
82
-
83
-
84
-
85
-
86
-
87
-
88
-
89
-
90
-
91
-
92
-
93
-
94
-
95
-
96
-
97
-
98
-
99
-
100
-
101
-
102
-
103
-
104
-
105
-
106
-
107
-
108
-
109
-
110
-
111
-
112
-
113
-
114
-
115
-
116
-
117
-
118
-
119
-
120
-
121
-
122
-
123
-
 124
124 -
 125
125 -
 126
126 -
 127
127 -
 128
128 -
 129
129 -
 130
130 -
 131
131 -
 132
132 -
 133
133 -
 134
134 -
 135
135 -
 136
136 -
 137
137 -
 138
138 -
 139
139 -
 140
140 -
 141
141 -
 142
142 -
 143
143 -
 144
144 -
145
-
146
-
147
-
148
-
149
-
150
-
151
-
152
-
153
-
154
-
155
-
156
-
157
-
158
-
159
-
160
-
161
-
162
-
163
-
164
-
165
-
166
-
167
-
168
-
169
-
170
-
171
-
172
-
173
-
174
-
175
-
176
-
177
-
178
-
179
-
180
-
181
-
182
-
183
-
184
-
185
-
186
-
187
-
188
-
189
-
190
-
191
-
192
-
193
-
194
-
195
-
196
-
197
-
198
-
199
-
200
-
201
-
202
-
203
-
204
-
205
-
206
-
207
-
208
-
209
-
210
-
211
-
212
-
213
-
214
-
215
-
216
-
217
-
218
-
219
-
220
-
221
-
222
-
223
-
224
-
225
-
226
-
227
-
228
-
229
-
230
-
231
-
232
-
233
-
234
-
235
-
236
-
237
-
238
-
239
-
240
-
241
-
242
-
243
-
244
-
245
-
246
-
247
-
248
-
249
-
250
-
251
-
252
-
253
-
254
-
255
-
256
-
257
-
258
-
259
-
260
-
261
-
262
-
263
-
264
-
265
-
266
-
267
-
268
-
269
-
270
-
271
-
272
-
273
-
274
-
275
-
276
-
277
-
278
-
279
-
280
-
281
-
282
-
283
-
284
-
285
-
286
-
287
-
288
-
289
-
290
-
291
-
292
-
293
-
294
-
295
-
296
-
297
-
298
-
299
-
300
-
301
-
302
-
303
-
304
-
305
-
306
-
307
-
308
-
309
-
310
-
311
-
312
-
313
-
314
-
315
-
316
-
317
-
318
-
319
-
320
-
321
-
322
-
323
-
324
-
325
-
326
-
327
-
328
-
329
-
330
-
331
-
332
-
333
-
334
-
335
-
336
-
337
-
338
-
339
-
340
-
341
-
342
-
343
-
344
-
345
-
346
-
347
-
348
-
349
-
350
-
351
-
352
-
353
-
354
-
355
-
356
-
357
-
358
-
359
-
360
-
361
-
362
-
363
-
364
-
365
-
366
-
367
-
368
-
369
-
370
-
371
-
372
-
373
-
374
-
375
-
376
-
377
-
378
-
379
-
380
-
381
-
382
-
383
-
384
-
385
-
386
-
387
-
388
-
389
-
390
-
391
-
392
-
393
-
394
-
395
-
396
-
397
-
398
-
399
-
400
-
401
-
402
-
403
-
404
-
405
-
406
 |
 |

Table of Contents
Index to Consolidated Financial Statements
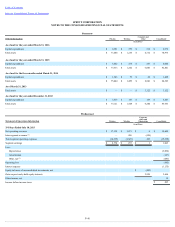
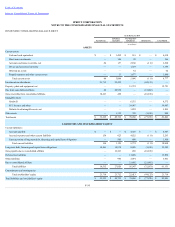
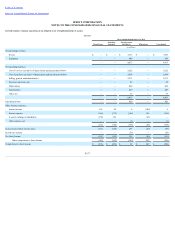
SPRINT CORPORATION
NOTES TO THE CONSOLIDATED FINANCIAL STATEMENTS
Predecessor
Operating Revenues by Service and Products Wireless
Wireline
Corporate,
Other and
Eliminations (1)
Consolidated
(in millions)
191 Days Ended July 10, 2013
Wireless services $ 15,139
$ —
$ —
$ 15,139
Wireless equipment 1,707
—
—
1,707
Voice —
771
(236)
535
Data —
188
(93)
95
Internet —
913
(100)
813
Other 279
29
5
313
Total net operating revenues $ 17,125
$ 1,901
$ (424)
$ 18,602
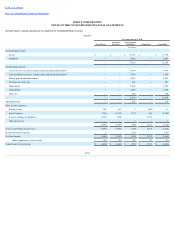
Wireless
Wireline
Corporate,
Other and
Eliminations (1)
Consolidated
(in millions)
Three Months Ended March 31, 2013 (unaudited)
Wireless services $ 7,143
$ —
$ —
$ 7,143
Wireless equipment 813
—
—
813
Voice —
352
(99)
253
Data —
94
(46)
48
Internet —
434
(47)
387
Other 133
13
3
149
Total net operating revenues $ 8,089
$ 893
$ (189)
$ 8,793
_______________
(1) RevenueseliminatedinconsolidationconsistprimarilyofwirelineservicesprovidedtotheWirelesssegmentforresaletoorusebywirelesssubscribers.
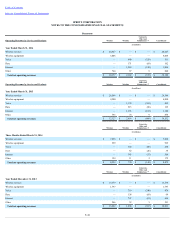
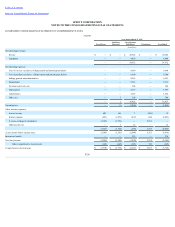
Note 16. Quarterly Financial Data (Unaudited)
Quarter
1st
2nd
3rd
4th
(in millions, except per share amounts)
Fiscal year 2015
Net operating revenues $ 8,027
$ 7,975
$ 8,107
$ 8,071
Operating income (loss) $ 501
$ (2)
$ (197)
$ 8
Net loss $ (20)
$ (585)
$ (836)
$ (554)
Basic and diluted loss per common share (1) $ (0.01)
$ (0.15)
$ (0.21)
$ (0.14)
Fiscal year 2014
Net operating revenues $ 8,789
$ 8,488
$ 8,973
$ 8,292
Operating income (loss) $ 519
$ (192)
$ (2,540)
$ 318
Net income (loss) $ 23
$ (765)
$ (2,379)
$ (224)
Basic and diluted income (loss) per common share (1) $ 0.01
$ (0.19)
$ (0.60)
$ (0.06)
_____________
(1) Thesumofthequarterlyearningspershareamountsmaynotequaltheannualamountsbecauseofthechangesintheweightedaveragenumberofsharesoutstanding
duringtheyear.
F-49