Sprint - Nextel 2015 Annual Report Download - page 188
Download and view the complete annual report
Please find page 188 of the 2015 Sprint - Nextel annual report below. You can navigate through the pages in the report by either clicking on the pages listed below, or by using the keyword search tool below to find specific information within the annual report.-
 1
1 -
2
-
3
-
4
-
5
-
6
-
7
-
8
-
9
-
10
-
11
-
12
-
13
-
14
-
15
-
16
-
17
-
18
-
19
-
20
-
21
-
22
-
23
-
24
-
25
-
26
-
27
-
28
-
29
-
30
-
31
-
32
-
33
-
34
-
35
-
36
-
37
-
38
-
39
-
40
-
41
-
42
-
43
-
44
-
45
-
46
-
47
-
48
-
49
-
50
-
51
-
52
-
53
-
54
-
55
-
56
-
57
-
58
-
59
-
60
-
61
-
62
-
63
-
64
-
65
-
66
-
67
-
68
-
69
-
70
-
71
-
72
-
73
-
74
-
75
-
76
-
77
-
78
-
79
-
80
-
81
-
82
-
83
-
84
-
85
-
86
-
87
-
88
-
89
-
90
-
91
-
92
-
93
-
94
-
95
-
96
-
97
-
98
-
99
-
100
-
101
-
102
-
103
-
104
-
105
-
106
-
107
-
108
-
109
-
110
-
111
-
112
-
113
-
114
-
115
-
116
-
117
-
118
-
119
-
120
-
121
-
122
-
123
-
124
-
125
-
126
-
127
-
128
-
129
-
130
-
131
-
132
-
133
-
134
-
135
-
136
-
137
-
138
-
139
-
140
-
141
-
142
-
143
-
144
-
145
-
146
-
147
-
148
-
149
-
150
-
151
-
152
-
153
-
154
-
155
-
156
-
157
-
158
-
159
-
160
-
161
-
162
-
163
-
164
-
165
-
166
-
167
-
168
-
169
-
170
-
171
-
172
-
173
-
174
-
175
-
176
-
177
-
 178
178 -
 179
179 -
 180
180 -
 181
181 -
 182
182 -
 183
183 -
 184
184 -
 185
185 -
 186
186 -
 187
187 -
 188
188 -
 189
189 -
 190
190 -
 191
191 -
 192
192 -
 193
193 -
 194
194 -
 195
195 -
 196
196 -
 197
197 -
 198
198 -
199
-
200
-
201
-
202
-
203
-
204
-
205
-
206
-
207
-
208
-
209
-
210
-
211
-
212
-
213
-
214
-
215
-
216
-
217
-
218
-
219
-
220
-
221
-
222
-
223
-
224
-
225
-
226
-
227
-
228
-
229
-
230
-
231
-
232
-
233
-
234
-
235
-
236
-
237
-
238
-
239
-
240
-
241
-
242
-
243
-
244
-
245
-
246
-
247
-
248
-
249
-
250
-
251
-
252
-
253
-
254
-
255
-
256
-
257
-
258
-
259
-
260
-
261
-
262
-
263
-
264
-
265
-
266
-
267
-
268
-
269
-
270
-
271
-
272
-
273
-
274
-
275
-
276
-
277
-
278
-
279
-
280
-
281
-
282
-
283
-
284
-
285
-
286
-
287
-
288
-
289
-
290
-
291
-
292
-
293
-
294
-
295
-
296
-
297
-
298
-
299
-
300
-
301
-
302
-
303
-
304
-
305
-
306
-
307
-
308
-
309
-
310
-
311
-
312
-
313
-
314
-
315
-
316
-
317
-
318
-
319
-
320
-
321
-
322
-
323
-
324
-
325
-
326
-
327
-
328
-
329
-
330
-
331
-
332
-
333
-
334
-
335
-
336
-
337
-
338
-
339
-
340
-
341
-
342
-
343
-
344
-
345
-
346
-
347
-
348
-
349
-
350
-
351
-
352
-
353
-
354
-
355
-
356
-
357
-
358
-
359
-
360
-
361
-
362
-
363
-
364
-
365
-
366
-
367
-
368
-
369
-
370
-
371
-
372
-
373
-
374
-
375
-
376
-
377
-
378
-
379
-
380
-
381
-
382
-
383
-
384
-
385
-
386
-
387
-
388
-
389
-
390
-
391
-
392
-
393
-
394
-
395
-
396
-
397
-
398
-
399
-
400
-
401
-
402
-
403
-
404
-
405
-
406
 |
 |

Table of Contents
Index to Consolidated Financial Statements
CLEARWIRE CORPORATION AND SUBSIDIARIES
NOTES TO CONSOLIDATED FINANCIAL STATEMENTS —(CONTINUED)
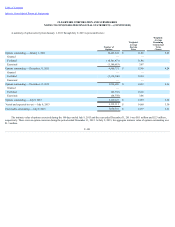
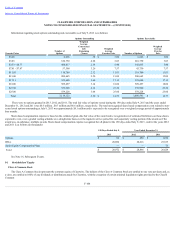
A summary of the RSU activity for the 190 day period ended July 9, 2013 , and the years ended 2012 and 2011 is presented below:
Restricted Stock Units
Weighted-
Average
Grant Price
Fair Value (In Millions)
Future
Performance and
Service Required
Future Service
Required
Future Performance
and Service
Required
Future Service
Required
Future Performance
and Service
Required
Future Service
Required
Restricted stock units outstanding — January 1,
2011 —
14,675,653
$ —
$ 5.99
Granted —
10,300,239
—
4.06
$ —
$ 44.9
Forfeited —
(7,985,495)
—
5.46
Vested —
(6,240,674)
—
5.54
$ —
$ 24.1
Restricted stock units outstanding —
December 31, 2011 —
10,749,723
$ —
$ 4.79
Granted 6,619,937
17,857,468
1.96
2.25
$ 13.0
$ 40.2
Forfeited (208,102)
(2,141,799)
1.99
3.32
Vested —
(4,501,785)
—
4.45
$ —
$ 8.4
Restricted stock units outstanding —
December 31, 2012 6,411,835
21,963,607
$ 1.96
$ 2.83
Granted —
11,637,901
—
3.19
$ —
$ 37.1
Forfeited (1,691,445)
(506,235)
1.96
7.77
Vested —
(7,913,173)
—
2.72
$ —
$ 26.0
Restricted stock units outstanding — July 9,
2013 4,720,390
25,182,100
$ 1.96
$ 3.03
As of July 9, 2013 , there were 29,902,490 RSUs outstanding and total unrecognized compensation cost of approximately $38.4 million , which is expected
to be recognized over a weighted-average period of approximately 1.1 years.
Stock Options
We granted options to certain officers and employees under the 2008 Plan. All options generally vest over a four-year period and expire no later than ten
years after the date of grant. The fair value of option grants was estimated on the date of grant using the Black-Scholes option pricing model.
F-102