Sprint - Nextel 2015 Annual Report Download - page 37
Download and view the complete annual report
Please find page 37 of the 2015 Sprint - Nextel annual report below. You can navigate through the pages in the report by either clicking on the pages listed below, or by using the keyword search tool below to find specific information within the annual report.-
 1
1 -
2
-
3
-
4
-
5
-
6
-
7
-
8
-
9
-
10
-
11
-
12
-
13
-
14
-
15
-
16
-
17
-
18
-
19
-
20
-
21
-
22
-
23
-
24
-
25
-
26
-
 27
27 -
 28
28 -
 29
29 -
 30
30 -
 31
31 -
 32
32 -
 33
33 -
 34
34 -
 35
35 -
 36
36 -
 37
37 -
 38
38 -
 39
39 -
 40
40 -
 41
41 -
 42
42 -
 43
43 -
 44
44 -
 45
45 -
 46
46 -
 47
47 -
48
-
49
-
50
-
51
-
52
-
53
-
54
-
55
-
56
-
57
-
58
-
59
-
60
-
61
-
62
-
63
-
64
-
65
-
66
-
67
-
68
-
69
-
70
-
71
-
72
-
73
-
74
-
75
-
76
-
77
-
78
-
79
-
80
-
81
-
82
-
83
-
84
-
85
-
86
-
87
-
88
-
89
-
90
-
91
-
92
-
93
-
94
-
95
-
96
-
97
-
98
-
99
-
100
-
101
-
102
-
103
-
104
-
105
-
106
-
107
-
108
-
109
-
110
-
111
-
112
-
113
-
114
-
115
-
116
-
117
-
118
-
119
-
120
-
121
-
122
-
123
-
124
-
125
-
126
-
127
-
128
-
129
-
130
-
131
-
132
-
133
-
134
-
135
-
136
-
137
-
138
-
139
-
140
-
141
-
142
-
143
-
144
-
145
-
146
-
147
-
148
-
149
-
150
-
151
-
152
-
153
-
154
-
155
-
156
-
157
-
158
-
159
-
160
-
161
-
162
-
163
-
164
-
165
-
166
-
167
-
168
-
169
-
170
-
171
-
172
-
173
-
174
-
175
-
176
-
177
-
178
-
179
-
180
-
181
-
182
-
183
-
184
-
185
-
186
-
187
-
188
-
189
-
190
-
191
-
192
-
193
-
194
-
195
-
196
-
197
-
198
-
199
-
200
-
201
-
202
-
203
-
204
-
205
-
206
-
207
-
208
-
209
-
210
-
211
-
212
-
213
-
214
-
215
-
216
-
217
-
218
-
219
-
220
-
221
-
222
-
223
-
224
-
225
-
226
-
227
-
228
-
229
-
230
-
231
-
232
-
233
-
234
-
235
-
236
-
237
-
238
-
239
-
240
-
241
-
242
-
243
-
244
-
245
-
246
-
247
-
248
-
249
-
250
-
251
-
252
-
253
-
254
-
255
-
256
-
257
-
258
-
259
-
260
-
261
-
262
-
263
-
264
-
265
-
266
-
267
-
268
-
269
-
270
-
271
-
272
-
273
-
274
-
275
-
276
-
277
-
278
-
279
-
280
-
281
-
282
-
283
-
284
-
285
-
286
-
287
-
288
-
289
-
290
-
291
-
292
-
293
-
294
-
295
-
296
-
297
-
298
-
299
-
300
-
301
-
302
-
303
-
304
-
305
-
306
-
307
-
308
-
309
-
310
-
311
-
312
-
313
-
314
-
315
-
316
-
317
-
318
-
319
-
320
-
321
-
322
-
323
-
324
-
325
-
326
-
327
-
328
-
329
-
330
-
331
-
332
-
333
-
334
-
335
-
336
-
337
-
338
-
339
-
340
-
341
-
342
-
343
-
344
-
345
-
346
-
347
-
348
-
349
-
350
-
351
-
352
-
353
-
354
-
355
-
356
-
357
-
358
-
359
-
360
-
361
-
362
-
363
-
364
-
365
-
366
-
367
-
368
-
369
-
370
-
371
-
372
-
373
-
374
-
375
-
376
-
377
-
378
-
379
-
380
-
381
-
382
-
383
-
384
-
385
-
386
-
387
-
388
-
389
-
390
-
391
-
392
-
393
-
394
-
395
-
396
-
397
-
398
-
399
-
400
-
401
-
402
-
403
-
404
-
405
-
406
 |
 |

Table of Contents
Wireless Segment Earnings Trends
Sprint is offering lower monthly service fees without a traditional contract as an incentive to attract subscribers to certain of our service plans. These
lower rates for service are available whether the subscriber brings their own handset, pays the full or near full retail price of the handset, purchases the handset
under our installment billing program, or leases their handset through our leasing program. As the adoption rates of these plans increase throughout our base of
subscribers, we expect our postpaid ARPU to continue to decline as a result of lower pricing associated with our new service plans as compared to our traditional
subsidized programs, which reflect higher service revenue and lower equipment revenue; however, we also expect higher equipment revenue due to the installment
billing and leasing programs to substantially offset these declines. Since inception, the combination of lower priced plans, and our installment billing and leasing
programs have been accretive to Wireless segment earnings. We expect that trend to continue with the magnitude of the impact being dependent upon the rate of
subscriber adoption.
We began to experience net losses of postpaid handset subscribers in mid-2013. Since the release of our new price plans, results have shown
improvement in trends of handset subscribers; however, there can be no assurance that this trend will continue. We have taken initiatives to provide the best value
in wireless service while continuing to enhance our network performance, coverage and capacity in order to attract and retain valuable handset subscribers. In
addition, we are evaluating our cost model to operationalize a more effective cost structure.
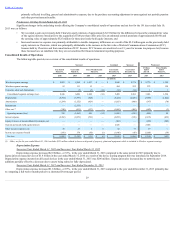
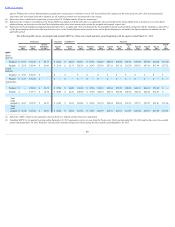
The following table provides an overview of the results of operations of our Wireless segment.
Successor
Combined
Successor
Predecessor
Year Ended
March 31,
Year Ended
March 31,
Three Months Ended
March 31,
Year Ended
December 31,
Year Ended
December 31,
191 Days Ended
July 10,
Three Months Ended
March 31,
Wireless Segment Earnings 2016
2015
2014
2013
2013
2013
2013
(in millions)
Postpaid $ 19,463
$ 21,181
$ 5,719
$ 23,442
$ 10,983
$ 12,459
$ 5,916
Prepaid 4,986
4,905
1,232
4,917
2,265
2,652
1,227
Other (1) 178
458
145
359
331
28
—
Retail service revenue 24,627
26,544
7,096
28,718
13,579
15,139
7,143
Wholesale, affiliate and other 744
793
159
545
266
279
133
Total service revenue 25,371
27,337
7,255
29,263
13,845
15,418
7,276
Cost of services (exclusive of depreciation and
amortization) (8,069)
(7,945)
(2,106)
(9,045)
(4,342)
(4,703)
(2,171)
Service gross margin 17,302
19,392
5,149
20,218
9,503
10,715
5,105
Service gross margin percentage 68%
71%
71%
69%
69%
69%
70%
Equipment revenue 5,006
4,990
999
3,504
1,797
1,707
813
Cost of products (exclusive of depreciation and
amortization) (5,795)
(9,309)
(2,038)
(9,475)
(4,603)
(4,872)
(2,293)
Selling, general and administrative expense (8,141)
(9,179)
(2,273)
(9,299)
(4,519)
(4,780)
(2,230)
Loss on disposal of property, plant and equipment (321)
—
—
—
—
—
—
Wireless segment earnings $ 8,051
$ 5,894
$ 1,837
$ 4,948
$ 2,178
$ 2,770
$ 1,395
___________________
(1)RepresentsservicerevenueprimarilyrelatedtotheacquisitionofClearwireonJuly9,2013.
Service Revenue
Our Wireless segment generates service revenue from the sale of wireless services and the sale of wholesale and other services. Service revenue
consists of fixed monthly recurring charges, variable usage charges and miscellaneous fees such as activation fees, directory assistance, roaming, equipment
protection, late payment and early termination charges, and certain regulatory related fees, net of service credits.
The ability of our Wireless segment to generate service revenue is primarily a function of:
• revenue generated from each subscriber, which in turn is a function of the types and amount of services utilized by each subscriber and the rates
charged for those services; and
• the number of subscribers that we serve, which in turn is a function of our ability to retain existing subscribers and acquire new subscribers.
Retail comprises those subscribers to whom Sprint directly provides wireless services, whether those services are provided on a postpaid or a prepaid
basis. We also categorize our retail subscribers as prime and subprime based upon subscriber credit profiles. We use proprietary scoring systems that measure the
credit quality of our subscribers using several
35