Sprint - Nextel 2015 Annual Report Download - page 183
Download and view the complete annual report
Please find page 183 of the 2015 Sprint - Nextel annual report below. You can navigate through the pages in the report by either clicking on the pages listed below, or by using the keyword search tool below to find specific information within the annual report.-
 1
1 -
2
-
3
-
4
-
5
-
6
-
7
-
8
-
9
-
10
-
11
-
12
-
13
-
14
-
15
-
16
-
17
-
18
-
19
-
20
-
21
-
22
-
23
-
24
-
25
-
26
-
27
-
28
-
29
-
30
-
31
-
32
-
33
-
34
-
35
-
36
-
37
-
38
-
39
-
40
-
41
-
42
-
43
-
44
-
45
-
46
-
47
-
48
-
49
-
50
-
51
-
52
-
53
-
54
-
55
-
56
-
57
-
58
-
59
-
60
-
61
-
62
-
63
-
64
-
65
-
66
-
67
-
68
-
69
-
70
-
71
-
72
-
73
-
74
-
75
-
76
-
77
-
78
-
79
-
80
-
81
-
82
-
83
-
84
-
85
-
86
-
87
-
88
-
89
-
90
-
91
-
92
-
93
-
94
-
95
-
96
-
97
-
98
-
99
-
100
-
101
-
102
-
103
-
104
-
105
-
106
-
107
-
108
-
109
-
110
-
111
-
112
-
113
-
114
-
115
-
116
-
117
-
118
-
119
-
120
-
121
-
122
-
123
-
124
-
125
-
126
-
127
-
128
-
129
-
130
-
131
-
132
-
133
-
134
-
135
-
136
-
137
-
138
-
139
-
140
-
141
-
142
-
143
-
144
-
145
-
146
-
147
-
148
-
149
-
150
-
151
-
152
-
153
-
154
-
155
-
156
-
157
-
158
-
159
-
160
-
161
-
162
-
163
-
164
-
165
-
166
-
167
-
168
-
169
-
170
-
171
-
172
-
 173
173 -
 174
174 -
 175
175 -
 176
176 -
 177
177 -
 178
178 -
 179
179 -
 180
180 -
 181
181 -
 182
182 -
 183
183 -
 184
184 -
 185
185 -
 186
186 -
 187
187 -
 188
188 -
 189
189 -
 190
190 -
 191
191 -
 192
192 -
 193
193 -
194
-
195
-
196
-
197
-
198
-
199
-
200
-
201
-
202
-
203
-
204
-
205
-
206
-
207
-
208
-
209
-
210
-
211
-
212
-
213
-
214
-
215
-
216
-
217
-
218
-
219
-
220
-
221
-
222
-
223
-
224
-
225
-
226
-
227
-
228
-
229
-
230
-
231
-
232
-
233
-
234
-
235
-
236
-
237
-
238
-
239
-
240
-
241
-
242
-
243
-
244
-
245
-
246
-
247
-
248
-
249
-
250
-
251
-
252
-
253
-
254
-
255
-
256
-
257
-
258
-
259
-
260
-
261
-
262
-
263
-
264
-
265
-
266
-
267
-
268
-
269
-
270
-
271
-
272
-
273
-
274
-
275
-
276
-
277
-
278
-
279
-
280
-
281
-
282
-
283
-
284
-
285
-
286
-
287
-
288
-
289
-
290
-
291
-
292
-
293
-
294
-
295
-
296
-
297
-
298
-
299
-
300
-
301
-
302
-
303
-
304
-
305
-
306
-
307
-
308
-
309
-
310
-
311
-
312
-
313
-
314
-
315
-
316
-
317
-
318
-
319
-
320
-
321
-
322
-
323
-
324
-
325
-
326
-
327
-
328
-
329
-
330
-
331
-
332
-
333
-
334
-
335
-
336
-
337
-
338
-
339
-
340
-
341
-
342
-
343
-
344
-
345
-
346
-
347
-
348
-
349
-
350
-
351
-
352
-
353
-
354
-
355
-
356
-
357
-
358
-
359
-
360
-
361
-
362
-
363
-
364
-
365
-
366
-
367
-
368
-
369
-
370
-
371
-
372
-
373
-
374
-
375
-
376
-
377
-
378
-
379
-
380
-
381
-
382
-
383
-
384
-
385
-
386
-
387
-
388
-
389
-
390
-
391
-
392
-
393
-
394
-
395
-
396
-
397
-
398
-
399
-
400
-
401
-
402
-
403
-
404
-
405
-
406
 |
 |

Table of Contents
Index to Consolidated Financial Statements
CLEARWIRE CORPORATION AND SUBSIDIARIES
NOTES TO CONSOLIDATED FINANCIAL STATEMENTS —(CONTINUED)
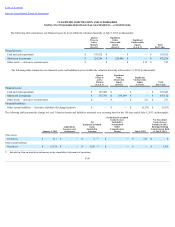
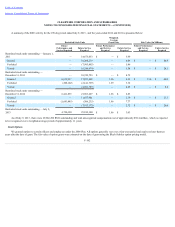
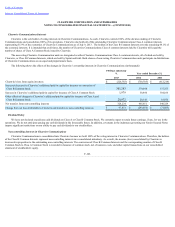
The following table presents the change in Level 3 financial assets and liabilities measured on a recurring basis for the year ended December 31, 2012 (in
thousands):
January 1, 2012
Acquisitions,
Issuances and
Settlements
Net Unrealized
Gains (Losses)
Included in
Earnings
Net Unrealized
Gains (Losses)
Included in
Accumulated
Other
Comprehensive
Income
December 31, 2012
Net Unrealized
Gains (Losses)
Included in 2011
Earnings Relating to
Instruments Held at
December 31, 2012
Other assets:
Derivatives $ 209
$ —
$ 2 (1)
$ —
$ 211
$ 2
Other current liabilities:
Derivatives $ (8,240)
$ 1,553
$ 1,354 (1)
$ —
$ (5,333)
$ 1,778
______________________________________
(1) Included in Gain on derivative instruments in the consolidated statements of operations.
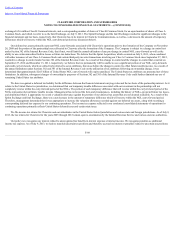
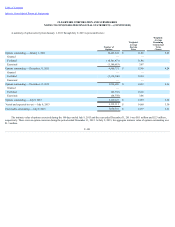
The following is the description of the fair value for financial instruments we hold that are not subject to fair value recognition.
Debt Instruments
To estimate the fair value of the 2015 Senior Secured Notes, the 2016 Senior Secured Notes, the Second-Priority Secured Notes and the Exchangeable Notes,
we used the average indicative price from several market makers.
A level of subjectivity is applied to estimate the fair value of the Sprint Notes. We use a market approach, benchmarking the price of the Sprint Notes to our
Exchangeable Notes, adjusting for differences in critical terms such as tenor and strike price of the options as well as liquidity.
To estimate the fair value of the Vendor Financing Notes, we used an income approach based on the contractual terms of the notes and market-based
parameters such as interest rates. A level of subjectivity is applied to estimate the discount rate used to calculate the present value of the estimated cash flows.
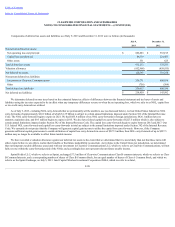
The following table presents the carrying value and the approximate fair value of our outstanding debt instruments at July 9, 2013 and 2012 (in thousands):
July 9, 2013
December 31, 2012
Carrying
Value
Fair Value
Carrying
Value
Fair Value
Notes:
2015 Senior Secured Notes $ 2,923,872
$ 3,167,127
$ 2,919,594
$ 3,180,238
2016 Senior Secured Notes $ 300,000
$ 412,500
$ 300,000
$ 414,375
Second-Priority Secured Notes $ 500,000
$ 583,125
$ 500,000
$ 591,565
Exchangeable Notes (1) $ 476,241
$ 696,164
$ 464,200
$ 689,598
Sprint Notes (2) $ 12,735
$ 176,713
$ —
$ —
Vendor Financing Notes $ 31,982
$ 32,458
$ 32,005
$ 31,802
_______________________________________
(1) Carrying value as of July 9, 2013 and December 31, 2012 is net of $153.0 million and $165.1 million discount, respectively, arising from the separation of the Exchange
Options from the debt host instrument. The fair value of the Exchangeable
F-97