Sprint - Nextel 2015 Annual Report Download - page 190
Download and view the complete annual report
Please find page 190 of the 2015 Sprint - Nextel annual report below. You can navigate through the pages in the report by either clicking on the pages listed below, or by using the keyword search tool below to find specific information within the annual report.-
 1
1 -
2
-
3
-
4
-
5
-
6
-
7
-
8
-
9
-
10
-
11
-
12
-
13
-
14
-
15
-
16
-
17
-
18
-
19
-
20
-
21
-
22
-
23
-
24
-
25
-
26
-
27
-
28
-
29
-
30
-
31
-
32
-
33
-
34
-
35
-
36
-
37
-
38
-
39
-
40
-
41
-
42
-
43
-
44
-
45
-
46
-
47
-
48
-
49
-
50
-
51
-
52
-
53
-
54
-
55
-
56
-
57
-
58
-
59
-
60
-
61
-
62
-
63
-
64
-
65
-
66
-
67
-
68
-
69
-
70
-
71
-
72
-
73
-
74
-
75
-
76
-
77
-
78
-
79
-
80
-
81
-
82
-
83
-
84
-
85
-
86
-
87
-
88
-
89
-
90
-
91
-
92
-
93
-
94
-
95
-
96
-
97
-
98
-
99
-
100
-
101
-
102
-
103
-
104
-
105
-
106
-
107
-
108
-
109
-
110
-
111
-
112
-
113
-
114
-
115
-
116
-
117
-
118
-
119
-
120
-
121
-
122
-
123
-
124
-
125
-
126
-
127
-
128
-
129
-
130
-
131
-
132
-
133
-
134
-
135
-
136
-
137
-
138
-
139
-
140
-
141
-
142
-
143
-
144
-
145
-
146
-
147
-
148
-
149
-
150
-
151
-
152
-
153
-
154
-
155
-
156
-
157
-
158
-
159
-
160
-
161
-
162
-
163
-
164
-
165
-
166
-
167
-
168
-
169
-
170
-
171
-
172
-
173
-
174
-
175
-
176
-
177
-
178
-
179
-
 180
180 -
 181
181 -
 182
182 -
 183
183 -
 184
184 -
 185
185 -
 186
186 -
 187
187 -
 188
188 -
 189
189 -
 190
190 -
 191
191 -
 192
192 -
 193
193 -
 194
194 -
 195
195 -
 196
196 -
 197
197 -
 198
198 -
 199
199 -
 200
200 -
201
-
202
-
203
-
204
-
205
-
206
-
207
-
208
-
209
-
210
-
211
-
212
-
213
-
214
-
215
-
216
-
217
-
218
-
219
-
220
-
221
-
222
-
223
-
224
-
225
-
226
-
227
-
228
-
229
-
230
-
231
-
232
-
233
-
234
-
235
-
236
-
237
-
238
-
239
-
240
-
241
-
242
-
243
-
244
-
245
-
246
-
247
-
248
-
249
-
250
-
251
-
252
-
253
-
254
-
255
-
256
-
257
-
258
-
259
-
260
-
261
-
262
-
263
-
264
-
265
-
266
-
267
-
268
-
269
-
270
-
271
-
272
-
273
-
274
-
275
-
276
-
277
-
278
-
279
-
280
-
281
-
282
-
283
-
284
-
285
-
286
-
287
-
288
-
289
-
290
-
291
-
292
-
293
-
294
-
295
-
296
-
297
-
298
-
299
-
300
-
301
-
302
-
303
-
304
-
305
-
306
-
307
-
308
-
309
-
310
-
311
-
312
-
313
-
314
-
315
-
316
-
317
-
318
-
319
-
320
-
321
-
322
-
323
-
324
-
325
-
326
-
327
-
328
-
329
-
330
-
331
-
332
-
333
-
334
-
335
-
336
-
337
-
338
-
339
-
340
-
341
-
342
-
343
-
344
-
345
-
346
-
347
-
348
-
349
-
350
-
351
-
352
-
353
-
354
-
355
-
356
-
357
-
358
-
359
-
360
-
361
-
362
-
363
-
364
-
365
-
366
-
367
-
368
-
369
-
370
-
371
-
372
-
373
-
374
-
375
-
376
-
377
-
378
-
379
-
380
-
381
-
382
-
383
-
384
-
385
-
386
-
387
-
388
-
389
-
390
-
391
-
392
-
393
-
394
-
395
-
396
-
397
-
398
-
399
-
400
-
401
-
402
-
403
-
404
-
405
-
406
 |
 |

Table of Contents
Index to Consolidated Financial Statements
CLEARWIRE CORPORATION AND SUBSIDIARIES
NOTES TO CONSOLIDATED FINANCIAL STATEMENTS —(CONTINUED)
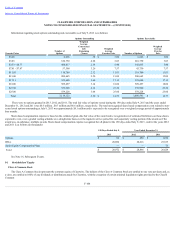
Information regarding stock options outstanding and exercisable as of July 9, 2013 is as follows:
Options Outstanding
Options Exercisable
Exercise Prices
Number of
Options
Weighted
Average
Contractual
Life
Remaining
(Years)
Weighted
Average
Exercise Price
Number of Options
Weighted
Average
Exercise
Price
$3.00
6,666
.78
$ 3.00
6,666
$ 3.00
$3.03
610,750
4.68
3.03
610,750
3.03
$3.53 - $6.77
400,617
2.34
5.90
345,835
5.80
$7.41 - $7.87
57,500
3.26
7.57
43,750
7.57
$11.03
110,700
2.12
11.03
110,700
11.03
$15.00
200,665
2.50
15.00
200,665
15.00
$17.11
323,600
1.60
17.11
323,600
17.11
$18.00
509,497
3.14
18.00
509,497
18.00
$23.30
339,900
4.14
23.30
339,900
23.30
$25.00
559,228
3.64
25.00
559,228
25.00
Total
3,119,123
3.30
$ 14.59
3,050,591
$ 14.77
There were no options granted in 2013, 2012 and 2011. The total fair value of options vested during the 190 days ended July 9, 2013 and the years ended
December 31, 2012 and 2011 was $0.5 million , $0.7 million and $6.6 million , respectively. The total unrecognized share based compensation costs related to non-
vested stock options outstanding at July 9, 2013 was approximately $0.1 million and is expected to be recognized over a weighted average period of approximately
four months .
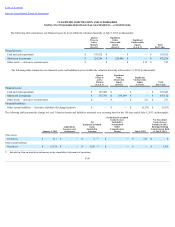
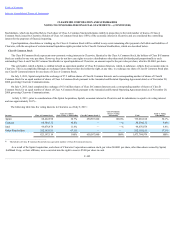
Share-based compensation expense is based on the estimated grant-date fair value of the award and is recognized net of estimated forfeitures on those shares
expected to vest, over a graded vesting schedule on a straight-line basis over the requisite service period for each separately vesting portion of the award as if the
award was, in-substance, multiple awards. Share-based compensation expense recognized for all plans for the 190 days ended July 9, 2013 , and for the years 2012
and 2011 is as follows (in thousands):
190 Days Ended July 9,
Year Ended December 31.
2013
2012
2011
Options $ 82
$ 250
$ 1,016
RSUs 20,890
28,616
25,535
Sprint Equity Compensation Plans —
—
73
Total $ 20,972
$ 28,866
$ 26,624
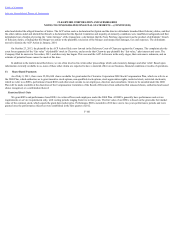
See Note 16, Subsequent Events.
14. Stockholders’ Equity
Class A Common Stock
The Class A Common Stock represents the common equity of Clearwire. The holders of the Class A Common Stock are entitled to one vote per share and, as
a class, are entitled to 100% of any dividends or distributions made by Clearwire, with the exception of certain minimal liquidation rights provided to the Class B
Common
F-104