Sprint - Nextel 2015 Annual Report Download - page 31
Download and view the complete annual report
Please find page 31 of the 2015 Sprint - Nextel annual report below. You can navigate through the pages in the report by either clicking on the pages listed below, or by using the keyword search tool below to find specific information within the annual report.-
 1
1 -
2
-
3
-
4
-
5
-
6
-
7
-
8
-
9
-
10
-
11
-
12
-
13
-
14
-
15
-
16
-
17
-
18
-
19
-
20
-
 21
21 -
 22
22 -
 23
23 -
 24
24 -
 25
25 -
 26
26 -
 27
27 -
 28
28 -
 29
29 -
 30
30 -
 31
31 -
 32
32 -
 33
33 -
 34
34 -
 35
35 -
 36
36 -
 37
37 -
 38
38 -
 39
39 -
 40
40 -
 41
41 -
42
-
43
-
44
-
45
-
46
-
47
-
48
-
49
-
50
-
51
-
52
-
53
-
54
-
55
-
56
-
57
-
58
-
59
-
60
-
61
-
62
-
63
-
64
-
65
-
66
-
67
-
68
-
69
-
70
-
71
-
72
-
73
-
74
-
75
-
76
-
77
-
78
-
79
-
80
-
81
-
82
-
83
-
84
-
85
-
86
-
87
-
88
-
89
-
90
-
91
-
92
-
93
-
94
-
95
-
96
-
97
-
98
-
99
-
100
-
101
-
102
-
103
-
104
-
105
-
106
-
107
-
108
-
109
-
110
-
111
-
112
-
113
-
114
-
115
-
116
-
117
-
118
-
119
-
120
-
121
-
122
-
123
-
124
-
125
-
126
-
127
-
128
-
129
-
130
-
131
-
132
-
133
-
134
-
135
-
136
-
137
-
138
-
139
-
140
-
141
-
142
-
143
-
144
-
145
-
146
-
147
-
148
-
149
-
150
-
151
-
152
-
153
-
154
-
155
-
156
-
157
-
158
-
159
-
160
-
161
-
162
-
163
-
164
-
165
-
166
-
167
-
168
-
169
-
170
-
171
-
172
-
173
-
174
-
175
-
176
-
177
-
178
-
179
-
180
-
181
-
182
-
183
-
184
-
185
-
186
-
187
-
188
-
189
-
190
-
191
-
192
-
193
-
194
-
195
-
196
-
197
-
198
-
199
-
200
-
201
-
202
-
203
-
204
-
205
-
206
-
207
-
208
-
209
-
210
-
211
-
212
-
213
-
214
-
215
-
216
-
217
-
218
-
219
-
220
-
221
-
222
-
223
-
224
-
225
-
226
-
227
-
228
-
229
-
230
-
231
-
232
-
233
-
234
-
235
-
236
-
237
-
238
-
239
-
240
-
241
-
242
-
243
-
244
-
245
-
246
-
247
-
248
-
249
-
250
-
251
-
252
-
253
-
254
-
255
-
256
-
257
-
258
-
259
-
260
-
261
-
262
-
263
-
264
-
265
-
266
-
267
-
268
-
269
-
270
-
271
-
272
-
273
-
274
-
275
-
276
-
277
-
278
-
279
-
280
-
281
-
282
-
283
-
284
-
285
-
286
-
287
-
288
-
289
-
290
-
291
-
292
-
293
-
294
-
295
-
296
-
297
-
298
-
299
-
300
-
301
-
302
-
303
-
304
-
305
-
306
-
307
-
308
-
309
-
310
-
311
-
312
-
313
-
314
-
315
-
316
-
317
-
318
-
319
-
320
-
321
-
322
-
323
-
324
-
325
-
326
-
327
-
328
-
329
-
330
-
331
-
332
-
333
-
334
-
335
-
336
-
337
-
338
-
339
-
340
-
341
-
342
-
343
-
344
-
345
-
346
-
347
-
348
-
349
-
350
-
351
-
352
-
353
-
354
-
355
-
356
-
357
-
358
-
359
-
360
-
361
-
362
-
363
-
364
-
365
-
366
-
367
-
368
-
369
-
370
-
371
-
372
-
373
-
374
-
375
-
376
-
377
-
378
-
379
-
380
-
381
-
382
-
383
-
384
-
385
-
386
-
387
-
388
-
389
-
390
-
391
-
392
-
393
-
394
-
395
-
396
-
397
-
398
-
399
-
400
-
401
-
402
-
403
-
404
-
405
-
406
 |
 |

Table of Contents
primarily reflected in selling, general and administrative expense, due to the purchase accounting adjustment to unrecognized net periodic pension
and other post-retirement benefits.
Predecessor191-DayPeriodEndedJuly10,2013
Significant changes in the underlying trends affecting the Company's consolidated results of operations and net loss for the 191 days ended July 10,
2013 were as follows:
• We recorded a gain on previously-held Clearwire equity interests of approximately $2.9 billion for the difference between the estimated fair value
of the equity interests owned prior to the acquisition ($5.00 per share offer price less an estimated control premium of approximately $0.60) and
the carrying value of approximately $325 million for those previously-held equity interests; and
•Increased income tax expense was primarily attributable to taxable temporary differences as a result of the $2.9 billion gain on the previously-held
equity interests in Clearwire, which was principally attributable to the increase in the fair value of Federal Communications Commission (FCC)
licenses held by Clearwire and from amortization of FCC licenses. FCC licenses are amortized over 15 years for income tax purposes but, because
these licenses have an indefinite life, they are not amortized for financial statement reporting purposes.
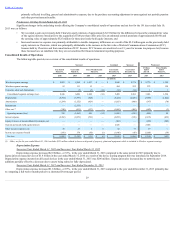
Consolidated Results of Operations
The following table provides an overview of the consolidated results of operations.
Successor
Combined
Successor
Predecessor
Year Ended
March 31,
Year Ended
March 31,
Three Months Ended
March 31,
Year Ended
December 31,
Year Ended
December 31,
191 Days
Ended
July 10,
Three Months
Ended
March 31,
2016
2015
2014
2013
2013
2013
2013
2013
(in millions)
Wireless segment earnings $ 8,051
$ 5,894
$ 1,837
$ —
$ 4,948
$ 2,178
$ 2,770
$ 1,395
Wireline segment earnings 92
113
12
—
494
222
272
128
Corporate, other and eliminations 3
(7)
(5)
(14)
(33)
(34)
1
1
Consolidated segment earnings (loss) 8,146
6,000
1,844
(14)
5,409
2,366
3,043
1,524
Depreciation (5,794)
(3,797)
(868)
—
(5,124)
(2,026)
(3,098)
(1,422)
Amortization (1,294)
(1,552)
(429)
—
(1,055)
(908)
(147)
(70)
Impairments —
(2,133)
—
—
—
—
—
—
Other, net (1) (748)
(413)
(127)
—
(1,085)
(402)
(683)
(3)
Operating income (loss) 310
(1,895)
420
(14)
(1,855)
(970)
(885)
29
Interest expense (2,182)
(2,051)
(516)
—
(2,053)
(918)
(1,135)
(432)
Equity in losses of unconsolidated investments, net —
—
—
—
(482)
—
(482)
(202)
Gain on previously-held equity interests —
—
—
—
2,926
—
2,926
—
Other income (expense), net 18
27
1
6
92
73
19
—
Income tax (expense) benefit (141)
574
(56)
(1)
(1,646)
(45)
(1,601)
(38)
Net loss $(1,995)
$(3,345)
$(151)
$(9)
$(3,018)
$(1,860)
$(1,158)
$(643)
_______________________
(1) Other,netfortheyearendedMarch31,2016excludes$321millionrelatedtolossesondisposalofproperty,plantandequipmentwhichisincludedinWirelesssegmentearnings.
Depreciation Expense
SuccessorYearEndedMarch31,2016andSuccessorYearEndedMarch31,2015
Depreciation expense increased $2.0 billion , or 53% , in the year ended March 31, 2016 compared to the same period in 2015 primarily due to
depreciation on leased devices of $1.8 billion in the year ended March 31, 2016 as a result of the device leasing program that was introduced in September 2014.
Depreciation expense incurred on all leased devices in the year ended March 31, 2015 was $206 million . Depreciation also increased due to network asset
additions partially offset by a decrease due to assets being retired or fully depreciated.
SuccessorYearEndedMarch31,2015andSuccessorYearEndedDecember31,2013
Depreciation expense increased $1.8 billion , or 87% , in the year ended March 31, 2015 compared to the year ended December 31, 2013 primarily due
to comparing a full twelve-month period to a shortened Post-merger period.
29