Sprint - Nextel 2015 Annual Report Download - page 47
Download and view the complete annual report
Please find page 47 of the 2015 Sprint - Nextel annual report below. You can navigate through the pages in the report by either clicking on the pages listed below, or by using the keyword search tool below to find specific information within the annual report.-
 1
1 -
2
-
3
-
4
-
5
-
6
-
7
-
8
-
9
-
10
-
11
-
12
-
13
-
14
-
15
-
16
-
17
-
18
-
19
-
20
-
21
-
22
-
23
-
24
-
25
-
26
-
27
-
28
-
29
-
30
-
31
-
32
-
33
-
34
-
35
-
36
-
 37
37 -
 38
38 -
 39
39 -
 40
40 -
 41
41 -
 42
42 -
 43
43 -
 44
44 -
 45
45 -
 46
46 -
 47
47 -
 48
48 -
 49
49 -
 50
50 -
 51
51 -
 52
52 -
 53
53 -
 54
54 -
 55
55 -
 56
56 -
 57
57 -
58
-
59
-
60
-
61
-
62
-
63
-
64
-
65
-
66
-
67
-
68
-
69
-
70
-
71
-
72
-
73
-
74
-
75
-
76
-
77
-
78
-
79
-
80
-
81
-
82
-
83
-
84
-
85
-
86
-
87
-
88
-
89
-
90
-
91
-
92
-
93
-
94
-
95
-
96
-
97
-
98
-
99
-
100
-
101
-
102
-
103
-
104
-
105
-
106
-
107
-
108
-
109
-
110
-
111
-
112
-
113
-
114
-
115
-
116
-
117
-
118
-
119
-
120
-
121
-
122
-
123
-
124
-
125
-
126
-
127
-
128
-
129
-
130
-
131
-
132
-
133
-
134
-
135
-
136
-
137
-
138
-
139
-
140
-
141
-
142
-
143
-
144
-
145
-
146
-
147
-
148
-
149
-
150
-
151
-
152
-
153
-
154
-
155
-
156
-
157
-
158
-
159
-
160
-
161
-
162
-
163
-
164
-
165
-
166
-
167
-
168
-
169
-
170
-
171
-
172
-
173
-
174
-
175
-
176
-
177
-
178
-
179
-
180
-
181
-
182
-
183
-
184
-
185
-
186
-
187
-
188
-
189
-
190
-
191
-
192
-
193
-
194
-
195
-
196
-
197
-
198
-
199
-
200
-
201
-
202
-
203
-
204
-
205
-
206
-
207
-
208
-
209
-
210
-
211
-
212
-
213
-
214
-
215
-
216
-
217
-
218
-
219
-
220
-
221
-
222
-
223
-
224
-
225
-
226
-
227
-
228
-
229
-
230
-
231
-
232
-
233
-
234
-
235
-
236
-
237
-
238
-
239
-
240
-
241
-
242
-
243
-
244
-
245
-
246
-
247
-
248
-
249
-
250
-
251
-
252
-
253
-
254
-
255
-
256
-
257
-
258
-
259
-
260
-
261
-
262
-
263
-
264
-
265
-
266
-
267
-
268
-
269
-
270
-
271
-
272
-
273
-
274
-
275
-
276
-
277
-
278
-
279
-
280
-
281
-
282
-
283
-
284
-
285
-
286
-
287
-
288
-
289
-
290
-
291
-
292
-
293
-
294
-
295
-
296
-
297
-
298
-
299
-
300
-
301
-
302
-
303
-
304
-
305
-
306
-
307
-
308
-
309
-
310
-
311
-
312
-
313
-
314
-
315
-
316
-
317
-
318
-
319
-
320
-
321
-
322
-
323
-
324
-
325
-
326
-
327
-
328
-
329
-
330
-
331
-
332
-
333
-
334
-
335
-
336
-
337
-
338
-
339
-
340
-
341
-
342
-
343
-
344
-
345
-
346
-
347
-
348
-
349
-
350
-
351
-
352
-
353
-
354
-
355
-
356
-
357
-
358
-
359
-
360
-
361
-
362
-
363
-
364
-
365
-
366
-
367
-
368
-
369
-
370
-
371
-
372
-
373
-
374
-
375
-
376
-
377
-
378
-
379
-
380
-
381
-
382
-
383
-
384
-
385
-
386
-
387
-
388
-
389
-
390
-
391
-
392
-
393
-
394
-
395
-
396
-
397
-
398
-
399
-
400
-
401
-
402
-
403
-
404
-
405
-
406
 |
 |

Table of Contents
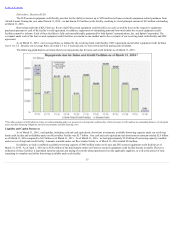
General and administrative costs were $897 million , representing a decrease of $27 million , or 3% , for the Successor three-month transition period
ended March 31, 2014 compared to the same Predecessor period in 2013 , primarily reflecting a decrease in customer care costs primarily due to lower call
volumes and labor related initiatives, partially offset by an increase in bad debt expense. Bad debt expense was $155 million for the three-month transition period
ended March 31, 2014 , representing a $72 million, or 87%, increase compared to bad debt expense of $83 million for the same Predecessor period in 2013 . The
increase in bad debt expense primarily reflects the impact of increased receivables related to our installment billing program.
Loss on Disposal of Property, Plant and Equipment
For the Successor year ended March 31, 2016 , loss on disposal of property, plant and equipment is a result of approximately $65 million in net losses
recognized upon the sale of devices to MLS under the Handset Sale-Leaseback Tranche 1 transaction, which represented the difference between the fair value and
net book value of the devices sold. In addition, approximately $256 million in losses resulted from the write-off of leased devices associated with lease
cancellations prior to the scheduled customer lease terms where customers did not return the devices to us. If customers continue to not return devices, we may
have material losses in future periods. Similar charges are and have been incurred for devices sold under our subsidy program as equipment net subsidy.
Segment Earnings - Wireline
We provide a broad suite of wireline voice and data communications services to other communications companies and targeted business subscribers. In
addition, we provide voice, data and IP communication services to our Wireless segment. We provide long distance services and operate all-digital global long
distance and Tier 1 IP networks. Our services and products include domestic and international data communications using various protocols such as multiprotocol
label switching technologies (MPLS), IP, managed network services, Voice over Internet Protocol (VoIP), Session Initiated Protocol (SIP), and traditional voice
services. Our IP services can also be combined with wireless services. Such services include our Sprint Mobile Integration service, which enables a wireless
handset to operate as part of a subscriber's wireline voice network, and our DataLink SM service, which uses our wireless networks to connect a subscriber location
into their primarily wireline wide-area IP/MPLS data network, making it easy for businesses to adapt their network to changing business requirements. In addition
to providing services to our business customers, the wireline network is carrying increasing amounts of voice and data traffic for our Wireless segment as a result
of growing usage by our wireless subscribers.
We continue to assess the portfolio of services provided by our Wireline business and are focusing our efforts on IP-based data services and de-
emphasizing stand-alone voice services and non-IP-based data services. We also continue to provide voice services primarily to business consumers. Our Wireline
segment markets and sells its services primarily through direct sales representatives.
Wireline segment earnings are primarily a function of wireline service revenue, network and interconnection costs, and other Wireline segment
operating expenses. Network costs primarily represent special access costs and interconnection costs, which generally consist of domestic and international per-
minute usage fees paid to other carriers. The remaining costs associated with operating the Wireline segment include the costs to operate our customer care and
billing organizations in addition to administrative support. Wireline service revenue and variable network and interconnection costs fluctuate with the changes in
our customer base and their related usage, but some cost elements do not fluctuate in the short term with the changes in our customer usage. Our wireline services
provided to our Wireless segment are generally accounted for based on market rates, which we believe approximate fair value. The Company generally re-
establishes these rates at the beginning of each fiscal year. Over the past several years, there has been an industry wide trend of lower rates due to increased
competition from other wireline and wireless communications companies as well as cable and Internet service providers. Declines in wireline segment earnings
related to intercompany pricing rates do not affect our consolidated results of operations as our Wireless segment benefits from an equivalent reduction in cost of
service.
45