Sprint - Nextel 2015 Annual Report Download - page 169
Download and view the complete annual report
Please find page 169 of the 2015 Sprint - Nextel annual report below. You can navigate through the pages in the report by either clicking on the pages listed below, or by using the keyword search tool below to find specific information within the annual report.-
 1
1 -
2
-
3
-
4
-
5
-
6
-
7
-
8
-
9
-
10
-
11
-
12
-
13
-
14
-
15
-
16
-
17
-
18
-
19
-
20
-
21
-
22
-
23
-
24
-
25
-
26
-
27
-
28
-
29
-
30
-
31
-
32
-
33
-
34
-
35
-
36
-
37
-
38
-
39
-
40
-
41
-
42
-
43
-
44
-
45
-
46
-
47
-
48
-
49
-
50
-
51
-
52
-
53
-
54
-
55
-
56
-
57
-
58
-
59
-
60
-
61
-
62
-
63
-
64
-
65
-
66
-
67
-
68
-
69
-
70
-
71
-
72
-
73
-
74
-
75
-
76
-
77
-
78
-
79
-
80
-
81
-
82
-
83
-
84
-
85
-
86
-
87
-
88
-
89
-
90
-
91
-
92
-
93
-
94
-
95
-
96
-
97
-
98
-
99
-
100
-
101
-
102
-
103
-
104
-
105
-
106
-
107
-
108
-
109
-
110
-
111
-
112
-
113
-
114
-
115
-
116
-
117
-
118
-
119
-
120
-
121
-
122
-
123
-
124
-
125
-
126
-
127
-
128
-
129
-
130
-
131
-
132
-
133
-
134
-
135
-
136
-
137
-
138
-
139
-
140
-
141
-
142
-
143
-
144
-
145
-
146
-
147
-
148
-
149
-
150
-
151
-
152
-
153
-
154
-
155
-
156
-
157
-
158
-
 159
159 -
 160
160 -
 161
161 -
 162
162 -
 163
163 -
 164
164 -
 165
165 -
 166
166 -
 167
167 -
 168
168 -
 169
169 -
 170
170 -
 171
171 -
 172
172 -
 173
173 -
 174
174 -
 175
175 -
 176
176 -
 177
177 -
 178
178 -
 179
179 -
180
-
181
-
182
-
183
-
184
-
185
-
186
-
187
-
188
-
189
-
190
-
191
-
192
-
193
-
194
-
195
-
196
-
197
-
198
-
199
-
200
-
201
-
202
-
203
-
204
-
205
-
206
-
207
-
208
-
209
-
210
-
211
-
212
-
213
-
214
-
215
-
216
-
217
-
218
-
219
-
220
-
221
-
222
-
223
-
224
-
225
-
226
-
227
-
228
-
229
-
230
-
231
-
232
-
233
-
234
-
235
-
236
-
237
-
238
-
239
-
240
-
241
-
242
-
243
-
244
-
245
-
246
-
247
-
248
-
249
-
250
-
251
-
252
-
253
-
254
-
255
-
256
-
257
-
258
-
259
-
260
-
261
-
262
-
263
-
264
-
265
-
266
-
267
-
268
-
269
-
270
-
271
-
272
-
273
-
274
-
275
-
276
-
277
-
278
-
279
-
280
-
281
-
282
-
283
-
284
-
285
-
286
-
287
-
288
-
289
-
290
-
291
-
292
-
293
-
294
-
295
-
296
-
297
-
298
-
299
-
300
-
301
-
302
-
303
-
304
-
305
-
306
-
307
-
308
-
309
-
310
-
311
-
312
-
313
-
314
-
315
-
316
-
317
-
318
-
319
-
320
-
321
-
322
-
323
-
324
-
325
-
326
-
327
-
328
-
329
-
330
-
331
-
332
-
333
-
334
-
335
-
336
-
337
-
338
-
339
-
340
-
341
-
342
-
343
-
344
-
345
-
346
-
347
-
348
-
349
-
350
-
351
-
352
-
353
-
354
-
355
-
356
-
357
-
358
-
359
-
360
-
361
-
362
-
363
-
364
-
365
-
366
-
367
-
368
-
369
-
370
-
371
-
372
-
373
-
374
-
375
-
376
-
377
-
378
-
379
-
380
-
381
-
382
-
383
-
384
-
385
-
386
-
387
-
388
-
389
-
390
-
391
-
392
-
393
-
394
-
395
-
396
-
397
-
398
-
399
-
400
-
401
-
402
-
403
-
404
-
405
-
406
 |
 |

Table of Contents
Index to Consolidated Financial Statements
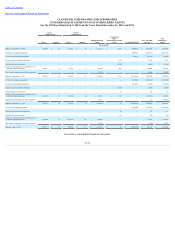
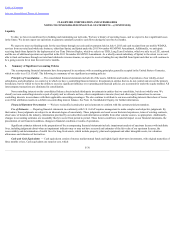
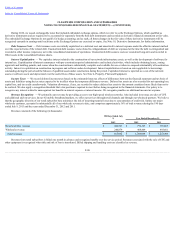
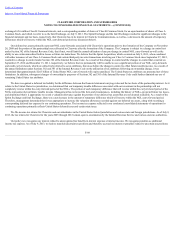
CLEARWIRE CORPORATION AND SUBSIDIARIES
NOTES TO CONSOLIDATED FINANCIAL STATEMENTS —(CONTINUED)
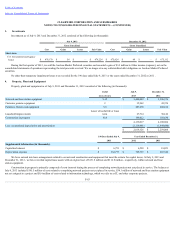
3. Investments
Investments as of July 9, 2013 and December 31, 2012 consisted of the following (in thousands):
July 9, 2013
December 31, 2012
Gross Unrealized
Gross Unrealized
Cost
Gains
Losses
Fair Value
Cost
Gains
Losses
Fair Value
Short-term
U.S. Government and Agency
Issues $ 476,170
$ 54
$ —
$ 476,224
$ 675,024
$ 88
$ —
$ 675,112
During the first quarter of 2012, we sold the Auction Market Preferred securities and recorded a gain of $3.3 million to Other income (expense), net on the
consolidated statements of operations representing the total proceeds received. We no longer own any collateralized debt obligations or Auction Market Preferred
securities.
No other-than-temporary impairment losses were recorded for the 190 days ended July 9, 2013 or the years ended December 31, 2012 or 2011 .
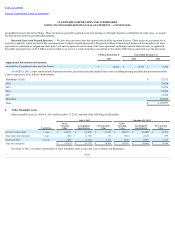
4. Property, Plant and Equipment
Property, plant and equipment as of July 9, 2013 and December 31, 2012 consisted of the following (in thousands):
Useful
July 9,
December 31,
Lives (Years)
2013
2012
Network and base station equipment 5-15
$ 3,400,849
$ 3,396,376
Customer premise equipment 2
35,962
45,376
Furniture, fixtures and equipment 3-5
487,470
480,160
Leasehold improvements
Lesser of useful life or lease
term
27,714
30,142
Construction in progress N/A
184,022
156,630
4,136,017
4,108,684
Less: accumulated depreciation and amortization
(2,116,691)
(1,849,680)
$ 2,019,326
$ 2,259,004
190 Days Ended July 9,
Year Ended December 31,
2013
2012
2011
Supplemental information (in thousands):
Capitalized interest $ 6,751
$ 6,598
$ 18,823
Depreciation expense $ 362,777
$ 749,765
$ 665,344
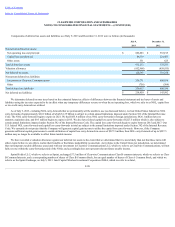
We have entered into lease arrangements related to our network construction and equipment that meet the criteria for capital leases. At July 9, 2013 and
December 31, 2012 , we have recorded capital lease assets with an original cost of $151.8 million and $112.8 million , respectively, within network and base
station equipment.
Construction in progress is primarily composed of costs incurred during the process of completing network projects not yet placed in service. The balance at
July 9, 2013 included $145.5 million of costs related to completing network projects not yet placed in service, $38.1 million of network and base station equipment
not yet assigned to a project and $0.4 million of costs related to information technology, which we refer to as IT, and other corporate projects.
F-83