Sprint - Nextel 2015 Annual Report Download - page 48
Download and view the complete annual report
Please find page 48 of the 2015 Sprint - Nextel annual report below. You can navigate through the pages in the report by either clicking on the pages listed below, or by using the keyword search tool below to find specific information within the annual report.-
 1
1 -
2
-
3
-
4
-
5
-
6
-
7
-
8
-
9
-
10
-
11
-
12
-
13
-
14
-
15
-
16
-
17
-
18
-
19
-
20
-
21
-
22
-
23
-
24
-
25
-
26
-
27
-
28
-
29
-
30
-
31
-
32
-
33
-
34
-
35
-
36
-
37
-
 38
38 -
 39
39 -
 40
40 -
 41
41 -
 42
42 -
 43
43 -
 44
44 -
 45
45 -
 46
46 -
 47
47 -
 48
48 -
 49
49 -
 50
50 -
 51
51 -
 52
52 -
 53
53 -
 54
54 -
 55
55 -
 56
56 -
 57
57 -
 58
58 -
59
-
60
-
61
-
62
-
63
-
64
-
65
-
66
-
67
-
68
-
69
-
70
-
71
-
72
-
73
-
74
-
75
-
76
-
77
-
78
-
79
-
80
-
81
-
82
-
83
-
84
-
85
-
86
-
87
-
88
-
89
-
90
-
91
-
92
-
93
-
94
-
95
-
96
-
97
-
98
-
99
-
100
-
101
-
102
-
103
-
104
-
105
-
106
-
107
-
108
-
109
-
110
-
111
-
112
-
113
-
114
-
115
-
116
-
117
-
118
-
119
-
120
-
121
-
122
-
123
-
124
-
125
-
126
-
127
-
128
-
129
-
130
-
131
-
132
-
133
-
134
-
135
-
136
-
137
-
138
-
139
-
140
-
141
-
142
-
143
-
144
-
145
-
146
-
147
-
148
-
149
-
150
-
151
-
152
-
153
-
154
-
155
-
156
-
157
-
158
-
159
-
160
-
161
-
162
-
163
-
164
-
165
-
166
-
167
-
168
-
169
-
170
-
171
-
172
-
173
-
174
-
175
-
176
-
177
-
178
-
179
-
180
-
181
-
182
-
183
-
184
-
185
-
186
-
187
-
188
-
189
-
190
-
191
-
192
-
193
-
194
-
195
-
196
-
197
-
198
-
199
-
200
-
201
-
202
-
203
-
204
-
205
-
206
-
207
-
208
-
209
-
210
-
211
-
212
-
213
-
214
-
215
-
216
-
217
-
218
-
219
-
220
-
221
-
222
-
223
-
224
-
225
-
226
-
227
-
228
-
229
-
230
-
231
-
232
-
233
-
234
-
235
-
236
-
237
-
238
-
239
-
240
-
241
-
242
-
243
-
244
-
245
-
246
-
247
-
248
-
249
-
250
-
251
-
252
-
253
-
254
-
255
-
256
-
257
-
258
-
259
-
260
-
261
-
262
-
263
-
264
-
265
-
266
-
267
-
268
-
269
-
270
-
271
-
272
-
273
-
274
-
275
-
276
-
277
-
278
-
279
-
280
-
281
-
282
-
283
-
284
-
285
-
286
-
287
-
288
-
289
-
290
-
291
-
292
-
293
-
294
-
295
-
296
-
297
-
298
-
299
-
300
-
301
-
302
-
303
-
304
-
305
-
306
-
307
-
308
-
309
-
310
-
311
-
312
-
313
-
314
-
315
-
316
-
317
-
318
-
319
-
320
-
321
-
322
-
323
-
324
-
325
-
326
-
327
-
328
-
329
-
330
-
331
-
332
-
333
-
334
-
335
-
336
-
337
-
338
-
339
-
340
-
341
-
342
-
343
-
344
-
345
-
346
-
347
-
348
-
349
-
350
-
351
-
352
-
353
-
354
-
355
-
356
-
357
-
358
-
359
-
360
-
361
-
362
-
363
-
364
-
365
-
366
-
367
-
368
-
369
-
370
-
371
-
372
-
373
-
374
-
375
-
376
-
377
-
378
-
379
-
380
-
381
-
382
-
383
-
384
-
385
-
386
-
387
-
388
-
389
-
390
-
391
-
392
-
393
-
394
-
395
-
396
-
397
-
398
-
399
-
400
-
401
-
402
-
403
-
404
-
405
-
406
 |
 |

Table of Contents
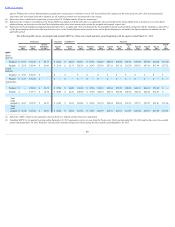
The following table provides an overview of the results of operations of our Wireline segment.
Successor
Combined
Successor
Predecessor
Year Ended
March 31,
Year Ended
March 31,
Three Months Ended
March 31,
Year Ended
December 31,
Year Ended
December 31,
191 Days Ended
July 10,
Three Months Ended
March 31,
Wireline Segment Earnings 2016
2015
2014
2013
2013
2013
2013
(in millions)
Voice $ 840
$ 1,174
$ 352
$ 1,490
$ 719
$ 771
$ 352
Data 171
213
62
326
138
188
94
Internet 1,284
1,353
345
1,660
747
913
434
Other 87
74
11
61
32
29
13
Total net service revenue 2,382
2,814
770
3,537
1,636
1,901
893
Cost of services (1,962)
(2,338)
(668)
(2,637)
(1,235)
(1,402)
(661)
Service gross margin 420
476
102
900
401
499
232
Service gross margin percentage 18%
17%
13%
25%
25%
26%
26%
Selling, general and administrative expense (328)
(363)
(90)
(406)
(179)
(227)
(104)
Wireline segment earnings $ 92
$ 113
$ 12
$ 494
$ 222
$ 272
$ 128
Wireline Revenue
SuccessorYearEndedMarch31,2016andSuccessorYearEndedMarch31,2015
VoiceRevenues
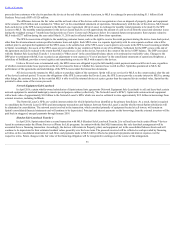
Voice revenues for the Successor year ended March 31, 2016 decreased $334 million , or 28% , compared to the Successor year ended March 31, 2015
. The decrease was primarily driven by lower volume and overall rate declines, primarily due to decreases in international hubbing volumes, combined with the
decline in prices for the sale of services to our Wireless segment. Voice revenues generated from the sale of services to our Wireless segment represented 39% of
total voice revenues for the Successor year ended March 31, 2016 compared to 31% in the year ended March 31, 2015 .
DataRevenues
Data revenues reflect sales of data services, primarily Private Line and managed network services bundled with non-IP-based data access. Data
revenues decreased $42 million , or 20% , for the Successor year ended March 31, 2016 compared to the Successor year ended March 31, 2015 as a result of
customer churn, primarily related to Private Line. Data revenues generated from the provision of services to the Wireless segment represented 40% of total data
revenue for each of the Successor year ended March 31, 2016 compared to 41% in the year ended March 31, 2015 .
InternetRevenue
IP-based data services revenue reflects sales of Internet services, including MPLS, VoIP, SIP, and managed services bundled with IP-based data access.
IP-based data services decreased $69 million , or 5% , for the Successor year ended March 31, 2016 compared to the Successor year ended March 31, 2015
primarily due to fewer IP customers. In addition, revenue was also impacted by a decline in prices for the sale of services to our Wireless segment. Sale of services
to our Wireless segment represented 15% of total Internet revenues for the Successor year ended March 31, 2016 compared to 12% in the year ended March 31,
2015 .
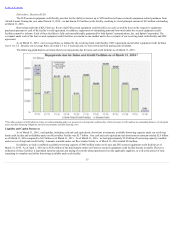
OtherRevenues
Other revenues, which primarily consist of sales of customer premises equipment, increased $13 million , or 18% , for the Successor year ended
March 31, 2016 compared to the Successor year ended March 31, 2015 .
SuccessorYearEndedMarch31,2015andSuccessorYearEndedDecember31,2013
VoiceRevenues
Voice revenues for the Successor year ended March 31, 2015 increased $455 million , or 63% , compared to the Successor year ended December 31,
2013 . The increase was primarily due to comparing results for a full twelve-month period to a shortened Post-merger period. Offsetting the increase were
decreases driven by lower volume and overall rate declines, primarily due to the decline in prices for the sale of services to our Wireless segment, combined with
decreases in international hubbing volumes, which resulted in an overall decrease in voice revenues when comparing the Successor year ended March 31, 2015 to
the Combined year ended December 31, 2013. Voice revenues generated from the sale of services to
46