Sprint - Nextel 2015 Annual Report Download - page 51
Download and view the complete annual report
Please find page 51 of the 2015 Sprint - Nextel annual report below. You can navigate through the pages in the report by either clicking on the pages listed below, or by using the keyword search tool below to find specific information within the annual report.-
 1
1 -
2
-
3
-
4
-
5
-
6
-
7
-
8
-
9
-
10
-
11
-
12
-
13
-
14
-
15
-
16
-
17
-
18
-
19
-
20
-
21
-
22
-
23
-
24
-
25
-
26
-
27
-
28
-
29
-
30
-
31
-
32
-
33
-
34
-
35
-
36
-
37
-
38
-
39
-
40
-
 41
41 -
 42
42 -
 43
43 -
 44
44 -
 45
45 -
 46
46 -
 47
47 -
 48
48 -
 49
49 -
 50
50 -
 51
51 -
 52
52 -
 53
53 -
 54
54 -
 55
55 -
 56
56 -
 57
57 -
 58
58 -
 59
59 -
 60
60 -
 61
61 -
62
-
63
-
64
-
65
-
66
-
67
-
68
-
69
-
70
-
71
-
72
-
73
-
74
-
75
-
76
-
77
-
78
-
79
-
80
-
81
-
82
-
83
-
84
-
85
-
86
-
87
-
88
-
89
-
90
-
91
-
92
-
93
-
94
-
95
-
96
-
97
-
98
-
99
-
100
-
101
-
102
-
103
-
104
-
105
-
106
-
107
-
108
-
109
-
110
-
111
-
112
-
113
-
114
-
115
-
116
-
117
-
118
-
119
-
120
-
121
-
122
-
123
-
124
-
125
-
126
-
127
-
128
-
129
-
130
-
131
-
132
-
133
-
134
-
135
-
136
-
137
-
138
-
139
-
140
-
141
-
142
-
143
-
144
-
145
-
146
-
147
-
148
-
149
-
150
-
151
-
152
-
153
-
154
-
155
-
156
-
157
-
158
-
159
-
160
-
161
-
162
-
163
-
164
-
165
-
166
-
167
-
168
-
169
-
170
-
171
-
172
-
173
-
174
-
175
-
176
-
177
-
178
-
179
-
180
-
181
-
182
-
183
-
184
-
185
-
186
-
187
-
188
-
189
-
190
-
191
-
192
-
193
-
194
-
195
-
196
-
197
-
198
-
199
-
200
-
201
-
202
-
203
-
204
-
205
-
206
-
207
-
208
-
209
-
210
-
211
-
212
-
213
-
214
-
215
-
216
-
217
-
218
-
219
-
220
-
221
-
222
-
223
-
224
-
225
-
226
-
227
-
228
-
229
-
230
-
231
-
232
-
233
-
234
-
235
-
236
-
237
-
238
-
239
-
240
-
241
-
242
-
243
-
244
-
245
-
246
-
247
-
248
-
249
-
250
-
251
-
252
-
253
-
254
-
255
-
256
-
257
-
258
-
259
-
260
-
261
-
262
-
263
-
264
-
265
-
266
-
267
-
268
-
269
-
270
-
271
-
272
-
273
-
274
-
275
-
276
-
277
-
278
-
279
-
280
-
281
-
282
-
283
-
284
-
285
-
286
-
287
-
288
-
289
-
290
-
291
-
292
-
293
-
294
-
295
-
296
-
297
-
298
-
299
-
300
-
301
-
302
-
303
-
304
-
305
-
306
-
307
-
308
-
309
-
310
-
311
-
312
-
313
-
314
-
315
-
316
-
317
-
318
-
319
-
320
-
321
-
322
-
323
-
324
-
325
-
326
-
327
-
328
-
329
-
330
-
331
-
332
-
333
-
334
-
335
-
336
-
337
-
338
-
339
-
340
-
341
-
342
-
343
-
344
-
345
-
346
-
347
-
348
-
349
-
350
-
351
-
352
-
353
-
354
-
355
-
356
-
357
-
358
-
359
-
360
-
361
-
362
-
363
-
364
-
365
-
366
-
367
-
368
-
369
-
370
-
371
-
372
-
373
-
374
-
375
-
376
-
377
-
378
-
379
-
380
-
381
-
382
-
383
-
384
-
385
-
386
-
387
-
388
-
389
-
390
-
391
-
392
-
393
-
394
-
395
-
396
-
397
-
398
-
399
-
400
-
401
-
402
-
403
-
404
-
405
-
406
 |
 |

Table of Contents
decline in revenue. Total selling, general and administrative expense as a percentage of net services revenue was 12% in each of the three-month periods ended
March 31, 2014 (Successor) and 2013 (Predecessor).
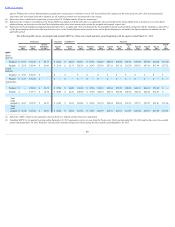
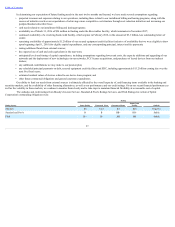
LIQUIDITY AND CAPITAL RESOURCES
Cash Flow
Successor
Combined
Successor
Predecessor
Year Ended
March 31,
Year Ended
March 31,
Three Months Ended
March 31,
Year Ended
December 31,
Year Ended
December 31,
191 Days
Ended
July 10,
Three Months
Ended
March 31,
2016
2015
2014
2013
2013
2013
2013
(in millions)
Net cash provided by (used in) operating activities $ 3,897
$ 2,450
$ 522
$ 2,610
$(61)
$ 2,671
$ 940
Net cash used in investing activities $ (5,735)
$(4,714)
$(1,756)
$(24,493)
$(18,108)
$(6,385)
$(1,158)
Net cash provided by (used in) financing activities $ 469
$ 1,304
$(160)
$ 24,419
$ 24,528
$(109)
$ 142
Operating Activities
Net cash provided by operating activities of approximately $3.9 billion in the Successor year ended March 31, 2016 increased $1.4 billion from the
same period in 2015 . This increase was due to lower vendor and labor-related payments of $2.2 billion which were primarily due to reduced operating costs
partially offset by reduced cash received from customers of $669 million. The reduction in cash received from customers was driven by the $2.4 billion decrease in
net operating revenues primarily due to lower average revenue per subscriber, which was offset by the $1.5 billion increase in operating cash flows resulting from
the net changes in accounts and notes receivables and Deferred Purchase Price (DPP) during the Successor year ended March 31, 2016 compared to the same
period in 2015. In addition, we had increased interest payments of $125 million primarily associated with $1.5 billion aggregate principal amount of notes issued in
February 2015.
The activities under our Receivables Facility impact the cash flows from both accounts and notes receivables and DPP. During the Successor year
ended March 31, 2016, the total cash inflows from the DPP were $2.5 billion. Approximately $1.2 billion of the cash inflows represented the settlement of the DPP
associated with the sale of service receivables on March 31, 2015, which occurred after we temporarily suspended the sale of new receivables in April 2016. In
September and October 2016, we began selling both service and installment receivables, respectively. The DPP associated with these initial non-cash transactions
amounted to $2.4 billion. Approximately $825 million of the cash inflows represented cash advances that we elected to draw against the DPP during the year.
Under the Receivables Facility, as cash collections on previously sold receivables exceed the sales of new receivables, we retain these amounts and apply them
against the DPP. During the successor year ended March 31, 2016, the DPP was reduced for these cash collections totaling approximately $400 million.
Net cash provided by operating activities of approximately $2.5 billion in the Successor year ended March 31, 2015 increased $2.5 billion from the
Successor year ended December 31, 2013 . The increase was primarily due to comparing a full twelve-month period to a shortened Post-merger period. The
Successor year ended December 31, 2013 included $180 million of call redemption premiums paid to retire the Clearwire debt and approximately $225 million of
interest payments related to Clearwire debt. Net cash provided by operating activities of approximately $2.5 billion in the Successor year ended March 31, 2015
decreased $160 million as compared to net cash provided by operating activities of approximately $2.6 billion for the year ended December 31, 2013 , on a
combined basis. The decrease was due to decreased cash received from customers of $1.1 billion primarily as a result of increases in installment billing receivables
offset by declines due to the sales of receivables through our receivables facility (see AccountsReceivablesFacilitybelow) as well as declines in net operating
revenues and increased interest payments of $505 million primarily related to the debt issued in September 2013 and December 2013. The decrease was partially
offset by lower vendor and labor-related payments of $1.4 billion, which were primarily due to (i) decreased backhaul payments related to the shut-down of the
Nextel platform in June 2013, (ii) declines in roaming payments due to lower volumes and rates, and (iii) fewer labor-related payments primarily as a result of
reductions in force, call center savings due to lower call volumes, and other labor-related initiatives. These lower payments were partially offset by increased cash
paid for inventory.
Net cash provided by operating activities of approximately $522 million in the Successor three-month transition period ended March 31, 2014
decreased $418 million from the same Predecessor period in 2013 . The decrease was due to decreased cash received from customers of $365 million primarily as a
result of increases in installment billing receivables and
49