Target 2008 Annual Report Download - page 17
Download and view the complete annual report
Please find page 17 of the 2008 Target annual report below. You can navigate through the pages in the report by either clicking on the pages listed below, or by using the keyword search tool below to find specific information within the annual report.-
 1
1 -
2
-
3
-
4
-
5
-
6
-
 7
7 -
 8
8 -
 9
9 -
 10
10 -
 11
11 -
 12
12 -
 13
13 -
 14
14 -
 15
15 -
 16
16 -
 17
17 -
 18
18 -
 19
19 -
 20
20 -
 21
21 -
 22
22 -
 23
23 -
 24
24 -
 25
25 -
 26
26 -
 27
27 -
28
-
29
-
30
-
31
-
32
-
33
-
34
-
35
-
36
-
37
-
38
-
39
-
40
-
41
-
42
-
43
-
44
-
45
-
46
-
47
-
48
-
49
-
50
-
51
-
52
-
53
-
54
-
55
-
56
-
57
-
58
-
59
-
60
-
61
-
62
-
63
-
64
-
65
-
66
-
67
-
68
-
69
-
70
-
71
-
72
-
73
-
74
-
75
-
76
-
77
-
78
-
79
-
80
-
81
-
82
-
83
-
84
 |
 |
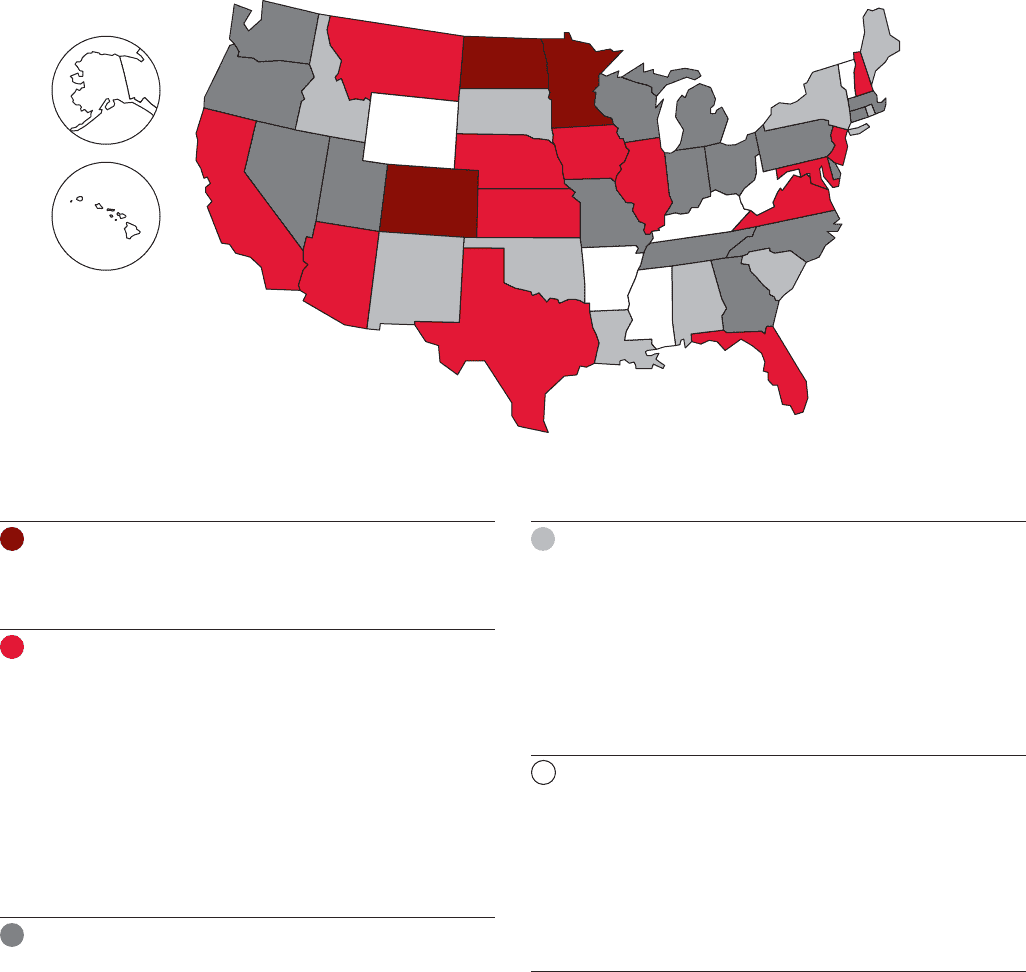
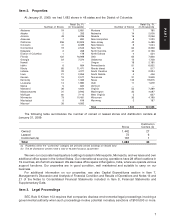
15
No. of Retail Sq. Ft.
Sales per Capita Group Stores (in thousands)
$101–$150
Alabama 19 2,681
Idaho 6 664
Louisiana 14 1,980
Maine 5 630
New Mexico 9 1,024
New York 62 8,328
Oklahoma 12 1,708
Rhode Island 4 517
South Carolina 18 2,224
South Dakota 4 446
Group Total 153 20,202
$0–$100
Alaska 2 333
Arkansas 7 890
District of Columbia 1 179
Hawaii 0 0
Kentucky 12 1,383
Mississippi 5 616
Vermont 0 0
West Virginia 5 627
Wyoming 2 187
Group Total 34 4,215
Total 1,682 222,588
No. of Retail Sq. Ft.
Sales per Capita Group Stores (in thousands)
Over $300
Colorado 41 6,089
Minnesota 73 10,481
North Dakota 4 554
Group Total 118 17,124
$201–$300
Arizona 48 6,296
California 236 30,909
Florida 122 16,998
Illinois 85 11,471
Iowa 21 2,855
Kansas 19 2,577
Maryland 36 4,644
Montana 7 780
Nebraska 14 2,006
New Hampshire 8 1,023
New Jersey 42 5,489
Texas 143 19,815
Virginia 55 7,289
Group Total 836 112,152
$151–$200
Connecticut 19 2,545
Delaware 2 268
Georgia 54 7,374
Indiana 33 4,377
Massachusetts 31 3,945
Michigan 60 7,110
Missouri 35 4,582
Nevada 16 2,056
North Carolina 47 6,156
Ohio 63 7,826
Oregon 18 2,180
Pennsylvania 51 6,552
Tennessee 31 3,949
Utah 11 1,679
Washington 35 4,097
Wisconsin 35 4,199
Group Total 541 68,895
YEAR-END STORE COUNT AND SQUARE FOOTAGE BY STATE
Sales per capita is defined as sales by state divided by state population.
2008 Sales Per Capita