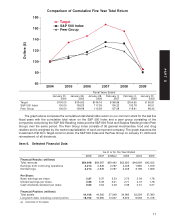
Target 2008 Annual Report Download - page 38
Download and view the complete annual report
Please find page 38 of the 2008 Target annual report below. You can navigate through the pages in the report by either clicking on the pages listed below, or by using the keyword search tool below to find specific information within the annual report.-
 1
1 -
2
-
3
-
4
-
5
-
6
-
7
-
8
-
9
-
10
-
11
-
12
-
13
-
14
-
15
-
16
-
17
-
18
-
19
-
20
-
21
-
22
-
23
-
24
-
25
-
26
-
27
-
 28
28 -
 29
29 -
 30
30 -
 31
31 -
 32
32 -
 33
33 -
 34
34 -
 35
35 -
 36
36 -
 37
37 -
 38
38 -
 39
39 -
 40
40 -
 41
41 -
 42
42 -
 43
43 -
 44
44 -
 45
45 -
 46
46 -
 47
47 -
 48
48 -
49
-
50
-
51
-
52
-
53
-
54
-
55
-
56
-
57
-
58
-
59
-
60
-
61
-
62
-
63
-
64
-
65
-
66
-
67
-
68
-
69
-
70
-
71
-
72
-
73
-
74
-
75
-
76
-
77
-
78
-
79
-
80
-
81
-
82
-
83
-
84
 |
 |

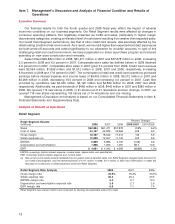
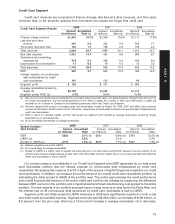
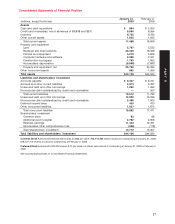
reduced credit lines and from notable reductions in card usage. As further described in Note 10, we sold an
interest in our credit card receivables to a JPMorgan Chase affiliate (JPMC). The interest sold represented
47 percent of the receivables portfolio at the time of the transaction.
Year-end inventory levels decreased $75 million, or 1.1 percent from 2007, reflecting inventory
management initiatives responding to declining consumer demand offset by increased inventory levels
required to support comparatively higher retail square footage. Accounts payable decreased by 5.7 percent
over the same period.
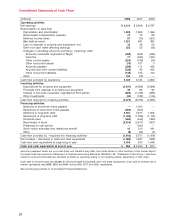
During 2008, we repurchased 67.2 million shares of our common stock for a total cash investment of
$3,395 million ($50.49 per share) under a $10 billion share repurchase plan authorized by our Board of
Directors in November 2007. In 2007 we repurchased 46.2 million shares of our common stock for a total cash
investment of $2,642 million ($57.24 per share). In November 2008 we announced that, in light of our business
outlook, we were temporarily suspending our open-market share repurchase program.
We declared dividends totaling $471 million ($0.62 per share) in 2008, an increase of 3.8 percent over
2007. In 2007 we declared dividends totaling $454 million ($0.54 per share), an increase of 14.6 percent over
2006. We have paid dividends every quarter since our first dividend was declared following our 1967 initial
public offering, and it is our intent to continue to do so in the future.
Our financing strategy is to ensure liquidity and access to capital markets, to manage our net exposure to
floating interest rate volatility, and to maintain a balanced spectrum of debt maturities. Within these
parameters, we seek to minimize our borrowing costs.
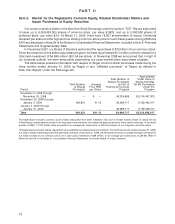
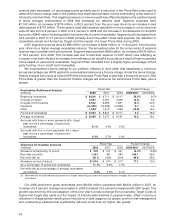
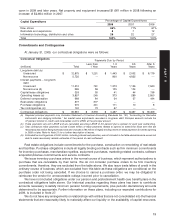
Maintaining strong investment-grade debt ratings is a key part of our financing strategy. Our current debt
ratings are as follows:
Standard andDebt Ratings
Moody’s Poor’s Fitch
Long-term debt A2 A+ A
Commercial paper P-1 A-1 F1
Securitized receivables (a) Aaa AA n/a
(a) These rated securitized receivables exclude the interest in our credit card receivables sold to JPMC.
At January 31, 2009 and February 2, 2008, there were no amounts outstanding under our commercial
paper program. We fund our peak sales season working capital needs through our commercial paper
program and typically use the cash generated from that sales season to repay the commercial paper issued.
Additionally and as described in Note 10, we sold to JPMC an interest in our credit card receivables for
approximately $3.8 billion. We received proceeds of approximately $3.6 billion, reflecting a 7 percent
discount.
An additional source of liquidity is available to us through a committed $2 billion unsecured revolving
credit facility obtained through a group of banks in April 2007, which will expire in April 2012. No balances
were outstanding at any time during 2008 or 2007 under this or previously existing revolving credit facilities.
Most of our long-term debt obligations contain covenants related to secured debt levels. In addition to a
secured debt level covenant, our credit facility also contains a debt leverage covenant. We are, and expect to
remain, in compliance with these covenants. Additionally, at January 31, 2009, no notes or debentures
contained provisions requiring acceleration of payment upon a debt rating downgrade, except that certain
outstanding notes allow the note holders to put the notes to us if within a matter of months of each other we
experience both (i) a change in control; and (ii) our long-term debt ratings are either reduced and the resulting
rating is non-investment grade, or our long-term debt ratings are placed on watch for possible reduction and
those ratings are subsequently reduced and the resulting rating is non-investment grade.
Our interest coverage ratio represents the ratio of pre-tax earnings before fixed charges to fixed charges.
Fixed charges include interest expense and the interest portion of rent expense. Our interest coverage ratio as
calculated by the SEC’s applicable rules was 4.3x in 2008, 6.4x in 2007 and 7.1x in 2006.
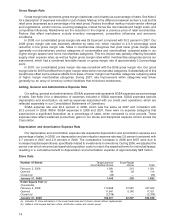
Capital Expenditures
Capital expenditures were $3,547 million in 2008, compared with $4,369 million in 2007 and
$3,928 million in 2006. This decrease was driven by lower capital expenditures for new stores, remodels and
technology-related assets. Our 2008 capital expenditures include $1,258 million related to stores that will
18