Target 2008 Annual Report Download - page 69
Download and view the complete annual report
Please find page 69 of the 2008 Target annual report below. You can navigate through the pages in the report by either clicking on the pages listed below, or by using the keyword search tool below to find specific information within the annual report.-
 1
1 -
2
-
3
-
4
-
5
-
6
-
7
-
8
-
9
-
10
-
11
-
12
-
13
-
14
-
15
-
16
-
17
-
18
-
19
-
20
-
21
-
22
-
23
-
24
-
25
-
26
-
27
-
28
-
29
-
30
-
31
-
32
-
33
-
34
-
35
-
36
-
37
-
38
-
39
-
40
-
41
-
42
-
43
-
44
-
45
-
46
-
47
-
48
-
49
-
50
-
51
-
52
-
53
-
54
-
55
-
56
-
57
-
58
-
 59
59 -
 60
60 -
 61
61 -
 62
62 -
 63
63 -
 64
64 -
 65
65 -
 66
66 -
 67
67 -
 68
68 -
 69
69 -
 70
70 -
 71
71 -
 72
72 -
 73
73 -
 74
74 -
 75
75 -
 76
76 -
 77
77 -
 78
78 -
 79
79 -
80
-
81
-
82
-
83
-
84
 |
 |

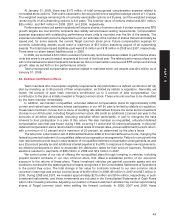
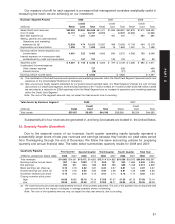
Prior service cost amortization is determined using the straight-line method over the average remaining
service period of team members expected to receive benefits under the plan.
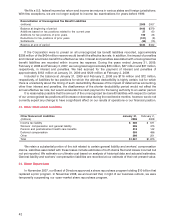
Defined Benefit Pension Plan Information
(millions) 2008 2007
Accumulated benefit obligation (ABO) for all plans (a) $1,812 $1,687
Projected benefit obligation for pension plans with an ABO in excess of plan
assets (b) 1,979 48
Total ABO for pension plans with an ABO in excess of plan assets 1,808 39
Fair value of plan assets for pension plans with an ABO in excess of plan assets 1,765 2
(a) The present value of benefits earned to date assuming no future salary growth.
(b) The present value of benefits earned to date by plan participants, including the effect of assumed future salary increases.
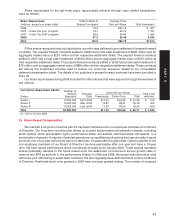
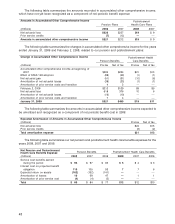
Assumptions
Weighted average assumptions used to determine benefit obligations as of the measurement date were
as follows:
Postretirement
Weighted Average Assumptions Pension Benefits Health Care Benefits
2008 2007 2008 2007
Discount rate 6.50% 6.45% 6.50% 6.45%
Average assumed rate of compensation increase 4.25% 4.25% n/a n/a
Weighted average assumptions used to determine net periodic benefit expense for each fiscal year were
as follows:
Postretirement
Weighted Average Assumptions Pension Benefits Health Care Benefits
2008 2007 2006 2008 2007 2006
Discount rate 6.45% 5.95% 5.75% 6.45% 5.95% 5.75%
Expected long-term rate of return
on plan assets 8.00% 8.00% 8.00% n/a n/a n/a
Average assumed rate of
compensation increase 4.25% 4.25% 3.50% n/a n/a n/a
The discount rate used to measure net periodic benefit expense each year is the rate as of the beginning
of the year (i.e., the prior measurement date). With an essentially stable asset allocation over the following
time periods, our annualized rate of return on qualified plans’ assets has averaged 6.3 percent, 5.7 percent
and 8.8 percent for the 5-year, 10-year and 15-year periods, respectively, ended January 31, 2009.
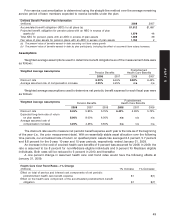
An increase in the cost of covered health care benefits of 9 percent was assumed for 2008. In 2009, the
rate is assumed to be 8 percent for non-Medicare eligible individuals and 9 percent for Medicare eligible
individuals. Both rates will be reduced to 5 percent in 2013 and thereafter.
A one percent change in assumed health care cost trend rates would have the following effects at
January 31, 2009:
Health Care Cost Trend Rates—1% Change
(millions) 1% Increase 1% Decrease
Effect on total of service and interest cost components of net periodic
postretirement health care benefit expense $1 $(1)
Effect on the health care component of the accumulated postretirement benefit
obligation $7 $(7)
49
PART II