Target 2008 Annual Report Download - page 33
Download and view the complete annual report
Please find page 33 of the 2008 Target annual report below. You can navigate through the pages in the report by either clicking on the pages listed below, or by using the keyword search tool below to find specific information within the annual report.-
 1
1 -
2
-
3
-
4
-
5
-
6
-
7
-
8
-
9
-
10
-
11
-
12
-
13
-
14
-
15
-
16
-
17
-
18
-
19
-
20
-
21
-
22
-
 23
23 -
 24
24 -
 25
25 -
 26
26 -
 27
27 -
 28
28 -
 29
29 -
 30
30 -
 31
31 -
 32
32 -
 33
33 -
 34
34 -
 35
35 -
 36
36 -
 37
37 -
 38
38 -
 39
39 -
 40
40 -
 41
41 -
 42
42 -
 43
43 -
44
-
45
-
46
-
47
-
48
-
49
-
50
-
51
-
52
-
53
-
54
-
55
-
56
-
57
-
58
-
59
-
60
-
61
-
62
-
63
-
64
-
65
-
66
-
67
-
68
-
69
-
70
-
71
-
72
-
73
-
74
-
75
-
76
-
77
-
78
-
79
-
80
-
81
-
82
-
83
-
84
 |
 |

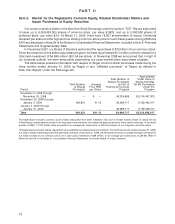
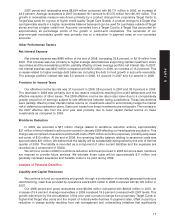
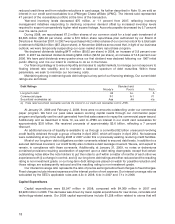
Sales
Sales include merchandise sales, net of expected returns, from our stores and our online business, as
well as gift card breakage. Refer to Note 2 for a definition of gift card breakage. Total sales for the Retail
Segment for the 2008 year were $62,884 million, compared with $61,471 million in 2007 and $57,878 million in
2006. The 2008 and 2007 periods were 52-week years compared to the 2006 period that was a 53-week year.
Growth in total sales between 2008 and 2007 resulted from sales from stores opened in 2008, offset by lower
comparable-store sales. The increase in total sales between 2007 and 2006 is attributable to both new stores
and comparable-store sales increases. In 2008, inflation affected sales growth by approximately 2 percentage
points, compared with a deflationary impact of 2 percent in 2007 and 1 percent in 2006.
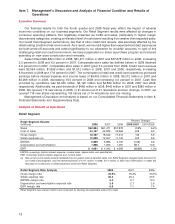
Percentage of Sales
Sales by Product Category
2008 2007 2006
Consumables and commodities 37% 34% 32%
Electronics, entertainment, sporting goods and toys 22 22 23
Apparel and accessories 20 22 22
Home furnishings and d´
ecor 21 22 23
Total 100% 100% 100%
Comparable-store sales is a measure that indicates the performance of our existing stores by measuring
the growth in sales for such stores for a period over the comparable, prior-year period of equivalent length.
The method of calculating comparable-store sales varies across the retail industry. As a result, our
comparable-store sales calculation is not necessarily comparable to similarly titled measures reported by
other companies. Additionally, beginning in 2007, we changed our comparable-store sales calculation to
include sales from our online business because we believe this combined measure represents a more useful
disclosure in light of our fully integrated, multi-channel approach to our business.
Comparable-store sales are sales from our online business and sales from general merchandise and
SuperTarget stores open longer than one year, including:
• sales from stores that have been remodeled or expanded while remaining open
• sales from stores that have been relocated to new buildings of the same format within the same trade
area, in which the new store opens at about the same time as the old store closes
Comparable-store sales do not include:
• sales from general merchandise stores that have been converted, or relocated within the same trade
area, to a SuperTarget store format
• sales from stores that were intentionally closed to be remodeled, expanded or reconstructed
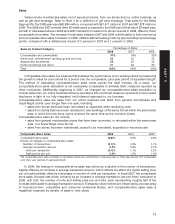
Comparable-Store Sales 2008 2007 2006
Comparable-store sales (2.9)% 3.0% 4.8%
Drivers of changes in comparable-store sales:
Number of transactions (3.1)% 0.3% 1.1%
Average transaction amount 0.2% 2.6% 3.7%
Units per transaction (2.1)% 1.1% 2.2%
Selling price per unit 2.3% 1.5% 1.4%
The comparable-store sales increases or decreases above are calculated by comparing sales in fiscal year periods with comparable
prior fiscal year periods of equivalent length.
In 2008, the change in comparable-store sales was driven by a decline in the number of transactions,
slightly offset by an increase in average transaction amount, which reflects the effect of a higher selling price
per unit sold partially offset by a decrease in number of units per transaction. In fiscal 2007, the comparable
store sales increase was driven primarily by an increase in average transaction amount when compared to
2006, with both the number of units and selling price per unit sold, each representing roughly half of the
increase attributable to average transaction amount. Transaction-level metrics are influenced by a broad array
of macroeconomic, competitive and consumer behavioral factors, and comparable-store sales rates is
negatively impacted by transfer of sales to new stores.
13
PART II