Target 2008 Annual Report Download - page 68
Download and view the complete annual report
Please find page 68 of the 2008 Target annual report below. You can navigate through the pages in the report by either clicking on the pages listed below, or by using the keyword search tool below to find specific information within the annual report.-
 1
1 -
2
-
3
-
4
-
5
-
6
-
7
-
8
-
9
-
10
-
11
-
12
-
13
-
14
-
15
-
16
-
17
-
18
-
19
-
20
-
21
-
22
-
23
-
24
-
25
-
26
-
27
-
28
-
29
-
30
-
31
-
32
-
33
-
34
-
35
-
36
-
37
-
38
-
39
-
40
-
41
-
42
-
43
-
44
-
45
-
46
-
47
-
48
-
49
-
50
-
51
-
52
-
53
-
54
-
55
-
56
-
57
-
 58
58 -
 59
59 -
 60
60 -
 61
61 -
 62
62 -
 63
63 -
 64
64 -
 65
65 -
 66
66 -
 67
67 -
 68
68 -
 69
69 -
 70
70 -
 71
71 -
 72
72 -
 73
73 -
 74
74 -
 75
75 -
 76
76 -
 77
77 -
 78
78 -
79
-
80
-
81
-
82
-
83
-
84
 |
 |

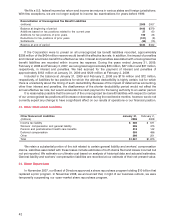
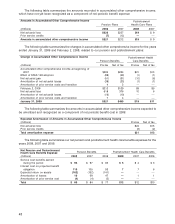
The following table summarizes the amounts recorded in accumulated other comprehensive income,
which have not yet been recognized as a component of net periodic benefit expense:
Amounts in Accumulated Other Comprehensive Income Postretirement
Pension Plans Health Care Plans
(millions) 2008 2007 2008 2007
Net actuarial loss $828 $227 $1 9 $9
Prior service credits (7) (15) ——
Amounts in accumulated other comprehensive income $821 $212 $1 9 $9
The following table summarizes the changes in accumulated other comprehensive income for the years
ended January 31, 2009 and February 2, 2008, related to our pension and postretirement plans:
Change in Accumulated Other Comprehensive Income Postretirement Health
Pension Benefits Care Benefits
(millions) Pre-tax Net of tax Pre-tax Net of tax
Accumulated other comprehensive income at beginning of
2007 $385 $234 $21 $13
Effect of SFAS 158 adoption (88) (53) (1) (1)
Net actuarial gain (51) (31) (10) (6)
Amortization of net actuarial losses (38) (23) (1) (1)
Amortization of prior service costs and transition 4 2 — —
February 2, 2008 $212 $129 $9 $5
Net actuarial loss 618 376 10 6
Amortization of net actuarial losses (16) (10) — —
Amortization of prior service costs and transition 7 4 — —
January 31, 2009 $821 $499 $19 $11
The following table summarizes the amounts in accumulated other comprehensive income expected to
be amortized and recognized as a component of net periodic benefit cost in 2009:
Expected Amortization of Amounts in Accumulated Other Comprehensive Income
(millions) Pre-tax Net of tax
Net actuarial loss $24 $15
Prior service credits (3) (2)
Total amortization expense $21 $13
The following table summarizes our net pension and postretirement health care benefits expenses for the
years 2008, 2007 and 2006:
Net Pension and Postretirement Pension Benefits Postretirement Health Care Benefits
Health Care Benefits Expense
(millions) 2008 2007 2006 2008 2007 2006
Service cost benefits earned
during the period $94 $97 $83 $5 $4 $3
Interest cost on projected benefit
obligation 116 105 93 776
Expected return on assets (162) (152) (141) ———
Amortization of losses 16 38 47 —11
Amortization of prior service cost (4) (4) (5) ———
Total $ 60 $84 $77 $12 $12 $10
48