Target 2008 Annual Report Download - page 36
Download and view the complete annual report
Please find page 36 of the 2008 Target annual report below. You can navigate through the pages in the report by either clicking on the pages listed below, or by using the keyword search tool below to find specific information within the annual report.-
 1
1 -
2
-
3
-
4
-
5
-
6
-
7
-
8
-
9
-
10
-
11
-
12
-
13
-
14
-
15
-
16
-
17
-
18
-
19
-
20
-
21
-
22
-
23
-
24
-
25
-
 26
26 -
 27
27 -
 28
28 -
 29
29 -
 30
30 -
 31
31 -
 32
32 -
 33
33 -
 34
34 -
 35
35 -
 36
36 -
 37
37 -
 38
38 -
 39
39 -
 40
40 -
 41
41 -
 42
42 -
 43
43 -
 44
44 -
 45
45 -
 46
46 -
47
-
48
-
49
-
50
-
51
-
52
-
53
-
54
-
55
-
56
-
57
-
58
-
59
-
60
-
61
-
62
-
63
-
64
-
65
-
66
-
67
-
68
-
69
-
70
-
71
-
72
-
73
-
74
-
75
-
76
-
77
-
78
-
79
-
80
-
81
-
82
-
83
-
84
 |
 |

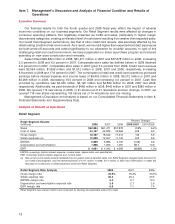
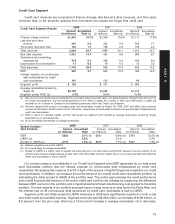
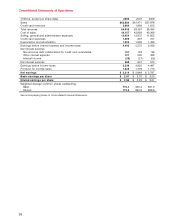
revenue yield decreased 2.4 percentage points primarily due to a reduction in the Prime Rate index used to
determine finance charge rates in the portfolio and lower external sales volume contributing to the decline in
third party merchant fees. This negative pressure on revenue yield was offset modestly by the positive impact
of terms changes implemented in 2008 that increased our effective yield. Segment expenses were
$1,742 million, an increase of $776 million, or 80.3 percent, from the prior year driven by an increase in bad
debt expense of $770 million. The increase in bad debt expense resulted from the increase in our incurred net
write-off rate from 5.9 percent in 2007 to 9.3 percent in 2008 and the increase in the allowance for doubtful
accounts of $440 million for anticipated future write-offs of current receivables. Segment profit decreased from
16.3 percent in 2007 to 3.7 percent in 2008 primarily due to the effect of bad debt expense, the reduction in
receivables owned and funded by Target, and the impact of a lower Prime Rate during 2008.
2007 segment revenues were $1,896 million, an increase of $284 million, or 17.6 percent, from the prior
year, driven by a higher average receivables balance. The annualized rates for the components of segment
revenue were consistent with prior periods. Segment expenses were $966 million, an increase of $136 million,
or 16.4 percent, from 2006. This increase was due to bad debt expense in 2007 which rose reflecting an
increase in net write-offs and an increase in the allowance for doubtful accounts as a result of higher expected
future losses on period-end receivables. Segment ROIC benefited from a slightly higher percentage of third
party funding of our credit card receivables.
We implemented a terms change to our portfolio, effective in April 2009, that establishes a minimum
annual percentage rate (APR) applied to a receivables balance as a finance charge. Under this terms change,
finance charges will accrue at a fixed APR if the benchmark Prime Rate is less than a threshold amount; if the
Prime Rate is greater than the threshold, finance charges will accrue at the benchmark Prime Rate, plus a
spread.
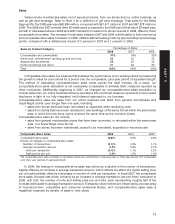
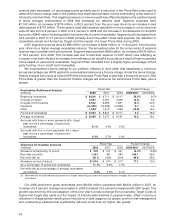
Fiscal Year Percent Change
Receivables Rollforward Analysis
(millions) 2008 2007 2006 2008/2007 2007/2006
Beginning receivables $ 8,624 $ 6,711 $ 6,117 28.5% 9.7%
Charges at Target 4,207 4,491 4,339 (6.3) 3.5
Charges at third parties 8,542 9,398 7,831 (9.1) 20.0
Payments (13,482) (13,388) (12,832) 0.7 4.3
Other 1,203 1,412 1,256 (14.8) 12.4
Period-end receivables $ 9,094 $ 8,624 $ 6,711 5.4 28.5
Average receivables $ 8,695 $ 7,275 $ 6,161 19.5 18.1
Accounts with three or more payments (60+ days)
past due as a percentage of period-end
receivables 6.1% 4.0% 3.5%
Accounts with four or more payments (90+ days)
past due as a percentage of period-end
receivables 4.3% 2.7% 2.4%
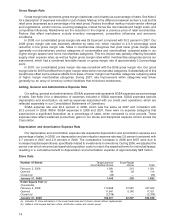
Fiscal Year Percent Change
Allowance for Doubtful Accounts
(millions) 2008 2007 2006 2008/2007 2007/2006
Allowance at beginning of period $ 570 $ 517 $ 451 10.4% 14.6%
Bad debt provision 1,251 481 380 160.1 26.5
Net write-offs (a) (811) (428) (314) 89.8 36.0
Allowance at end of period $1,010 $ 570 $ 517 77.1 10.4
As a percentage of period-end receivables 11.1% 6.6% 7.7%
Net write-offs as a percentage of average receivables
(annualized) 9.3% 5.9% 5.1%
(a) Net write-offs include the principal amount of losses (excluding accrued and unpaid finance charges) less current period principal
recoveries.
Our 2008 period-end gross receivables were $9,094 million compared with $8,624 million in 2007, an
increase of 5.4 percent. Average receivables in 2008 increased 19.5 percent compared with 2007 levels. This
growth was driven by the annualization of the prior year’s product change from proprietary Target Cards to
higher-limit Target Visa cards and the impact of industry-wide declines in payment rates, offset in part by a
reduction in charge activity resulting from reductions in card usage by our guests, and from risk management
and underwriting initiatives that significantly reduced credit lines for higher risk guests.
16