Target 2008 Annual Report Download - page 32
Download and view the complete annual report
Please find page 32 of the 2008 Target annual report below. You can navigate through the pages in the report by either clicking on the pages listed below, or by using the keyword search tool below to find specific information within the annual report.-
 1
1 -
2
-
3
-
4
-
5
-
6
-
7
-
8
-
9
-
10
-
11
-
12
-
13
-
14
-
15
-
16
-
17
-
18
-
19
-
20
-
21
-
 22
22 -
 23
23 -
 24
24 -
 25
25 -
 26
26 -
 27
27 -
 28
28 -
 29
29 -
 30
30 -
 31
31 -
 32
32 -
 33
33 -
 34
34 -
 35
35 -
 36
36 -
 37
37 -
 38
38 -
 39
39 -
 40
40 -
 41
41 -
 42
42 -
43
-
44
-
45
-
46
-
47
-
48
-
49
-
50
-
51
-
52
-
53
-
54
-
55
-
56
-
57
-
58
-
59
-
60
-
61
-
62
-
63
-
64
-
65
-
66
-
67
-
68
-
69
-
70
-
71
-
72
-
73
-
74
-
75
-
76
-
77
-
78
-
79
-
80
-
81
-
82
-
83
-
84
 |
 |

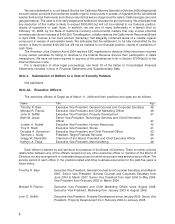
Item 7. Management’s Discussion and Analysis of Financial Condition and Results of
Operations
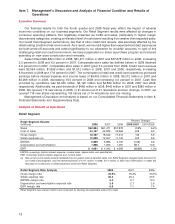
Executive Summary
Our financial results for both the fourth quarter and 2008 fiscal year reflect the impact of adverse
economic conditions on our business segments. Our Retail Segment results were affected by changes in
consumer spending patterns that negatively impacted our traffic and sales, particularly in higher margin
discretionary categories, creating an elevated level of markdowns resulting from weaker than expected sales.
Our Credit Card Segment performance, like that of other credit card issuers, was adversely affected by the
deteriorating credit and risk environment. As a result, we incurred higher-than-expected bad debt expense as
we both wrote-off accounts and added significantly to our allowance for doubtful accounts. In light of this
challenging retail and credit environment, we have suspended our share repurchase program and reduced
spending on new store construction and remodels.
Sales totaled $62,884 million in 2008, $61,471 million in 2007 and $57,878 million in 2006, increasing
2.3 percent in 2008 and 6.2 percent in 2007. Comparable-store sales (as defined below) in 2008 declined
2.9 percent from 2007; comparable-store sales in 2007 grew 3.0 percent from 2006. Credit card revenues
were $2,064 million, $1,896 million and $1,612 million in 2008, 2007 and 2006, respectively, increasing
8.9 percent in 2008 and 17.6 percent in 2007. The combination of retail and credit card operations produced
earnings before interest expense and income taxes of $4,402 million in 2008, $5,272 million in 2007 and
$5,069 million in 2006, decreasing 16.5 percent in 2008 and increasing 4.0 percent in 2007. Cash flow
provided by operations was $4,430 million, $4,125 million and $4,862 million for 2008, 2007 and 2006,
respectively. Additionally, we paid dividends of $465 million in 2008, $442 million in 2007 and $380 million in
2006. We opened 114 new stores in 2008, or 91 stores net of 21 relocations and two closings. In 2007, we
opened 118 new stores representing 103 stores net of 14 relocations and one closing.
Management’s Discussion and Analysis is based on our Consolidated Financial Statements in Item 8,
Financial Statements and Supplementary Data.
Analysis of Results of Operations
Retail Segment
Percent Change
Retail Segment Results
(millions) 2008 2007 2006 2008/2007 2007/2006
Sales $62,884 $61,471 $57,878 2.3% 6.2%
Cost of sales 44,157 42,929 40,366 2.9 6.3
Gross margin 18,727 18,542 17,512 1.0 5.9
SG&A expenses (a) 12,838 12,557 11,745 2.2 6.9
EBITDA 5,889 5,985 5,767 (1.6) 3.8
Depreciation and amortization 1,808 1,643 1,481 10.1 10.9
EBIT $ 4,081 $ 4,342 $ 4,286 (6.0)% 1.3%
EBITDA is earnings before interest expense, income taxes, depreciation and amortization.
EBIT is earnings before interest expense and income taxes.
(a) New account and loyalty rewards redeemed by our guests reduce reported sales. Our Retail Segment charges these discounts to
our Credit Card Segment, and the reimbursements of $117 million in 2008, $114 million in 2007 and $109 million in 2006, are
recorded as a reduction to SG&A expenses within the Retail Segment.
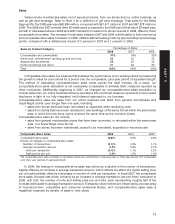
Retail Segment Rate Analysis 2008 2007 2006
Gross margin rate 29.8% 30.2% 30.3%
SG&A expense rate 20.4 20.4 20.3
EBITDA margin rate 9.4 9.7 10.0
Depreciation and amortization expense rate 2.9 2.7 2.6
EBIT margin rate 6.5 7.1 7.4
Retail Segment rate analysis metrics are computed by dividing the applicable amount by sales.
12