Target 2008 Annual Report Download - page 47
Download and view the complete annual report
Please find page 47 of the 2008 Target annual report below. You can navigate through the pages in the report by either clicking on the pages listed below, or by using the keyword search tool below to find specific information within the annual report.-
 1
1 -
2
-
3
-
4
-
5
-
6
-
7
-
8
-
9
-
10
-
11
-
12
-
13
-
14
-
15
-
16
-
17
-
18
-
19
-
20
-
21
-
22
-
23
-
24
-
25
-
26
-
27
-
28
-
29
-
30
-
31
-
32
-
33
-
34
-
35
-
36
-
 37
37 -
 38
38 -
 39
39 -
 40
40 -
 41
41 -
 42
42 -
 43
43 -
 44
44 -
 45
45 -
 46
46 -
 47
47 -
 48
48 -
 49
49 -
 50
50 -
 51
51 -
 52
52 -
 53
53 -
 54
54 -
 55
55 -
 56
56 -
 57
57 -
58
-
59
-
60
-
61
-
62
-
63
-
64
-
65
-
66
-
67
-
68
-
69
-
70
-
71
-
72
-
73
-
74
-
75
-
76
-
77
-
78
-
79
-
80
-
81
-
82
-
83
-
84
 |
 |

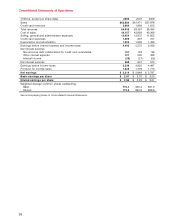
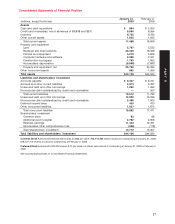
Consolidated Statements of Financial Position
January 31, February 2,
(millions, except footnotes) 2009 2008
Assets
Cash and cash equivalents $ 864 $ 2,450
Credit card receivables, net of allowance of $1,010 and $570 8,084 8,054
Inventory 6,705 6,780
Other current assets 1,835 1,622
Total current assets 17,488 18,906
Property and equipment
Land 5,767 5,522
Buildings and improvements 20,430 18,329
Fixtures and equipment 4,270 3,858
Computer hardware and software 2,586 2,421
Construction-in-progress 1,763 1,852
Accumulated depreciation (9,060) (7,887)
Property and equipment, net 25,756 24,095
Other noncurrent assets 862 1,559
Total assets $44,106 $44,560
Liabilities and shareholders’ investment
Accounts payable $ 6,337 $ 6,721
Accrued and other current liabilities 2,913 3,097
Unsecured debt and other borrowings 1,262 1,464
Nonrecourse debt collateralized by credit card receivables —500
Total current liabilities 10,512 11,782
Unsecured debt and other borrowings 12,000 13,226
Nonrecourse debt collateralized by credit card receivables 5,490 1,900
Deferred income taxes 455 470
Other noncurrent liabilities 1,937 1,875
Total noncurrent liabilities 19,882 17,471
Shareholders’ investment
Common stock 63 68
Additional paid-in-capital 2,762 2,656
Retained earnings 11,443 12,761
Accumulated other comprehensive loss (556) (178)
Total shareholders’ investment 13,712 15,307
Total liabilities and shareholders’ investment $44,106 $44,560
Common Stock Authorized 6,000,000,000 shares, $.0833 par value; 752,712,464 shares issued and outstanding at January 31, 2009;
818,737,715 shares issued and outstanding at February 2, 2008
Preferred Stock Authorized 5,000,000 shares, $.01 par value; no shares were issued or outstanding at January 31, 2009 or February 2,
2008
See accompanying Notes to Consolidated Financial Statements.
27
PART II